Surface code diagrams are everywhere in quantum error correction papers, but they can look like abstract art if you don’t know what you’re looking at.

Those colorful grids and symbols actually encode crucial information about how qubits are arranged and how errors get detected. The field has developed a whole visual language for this, and once you learn to read it, these diagrams become a powerful shorthand for understanding what a QEC code is doing.
In this post, we’ll break down what all those shapes and colors actually mean, using the surface code as our example.
Encoding quantum information
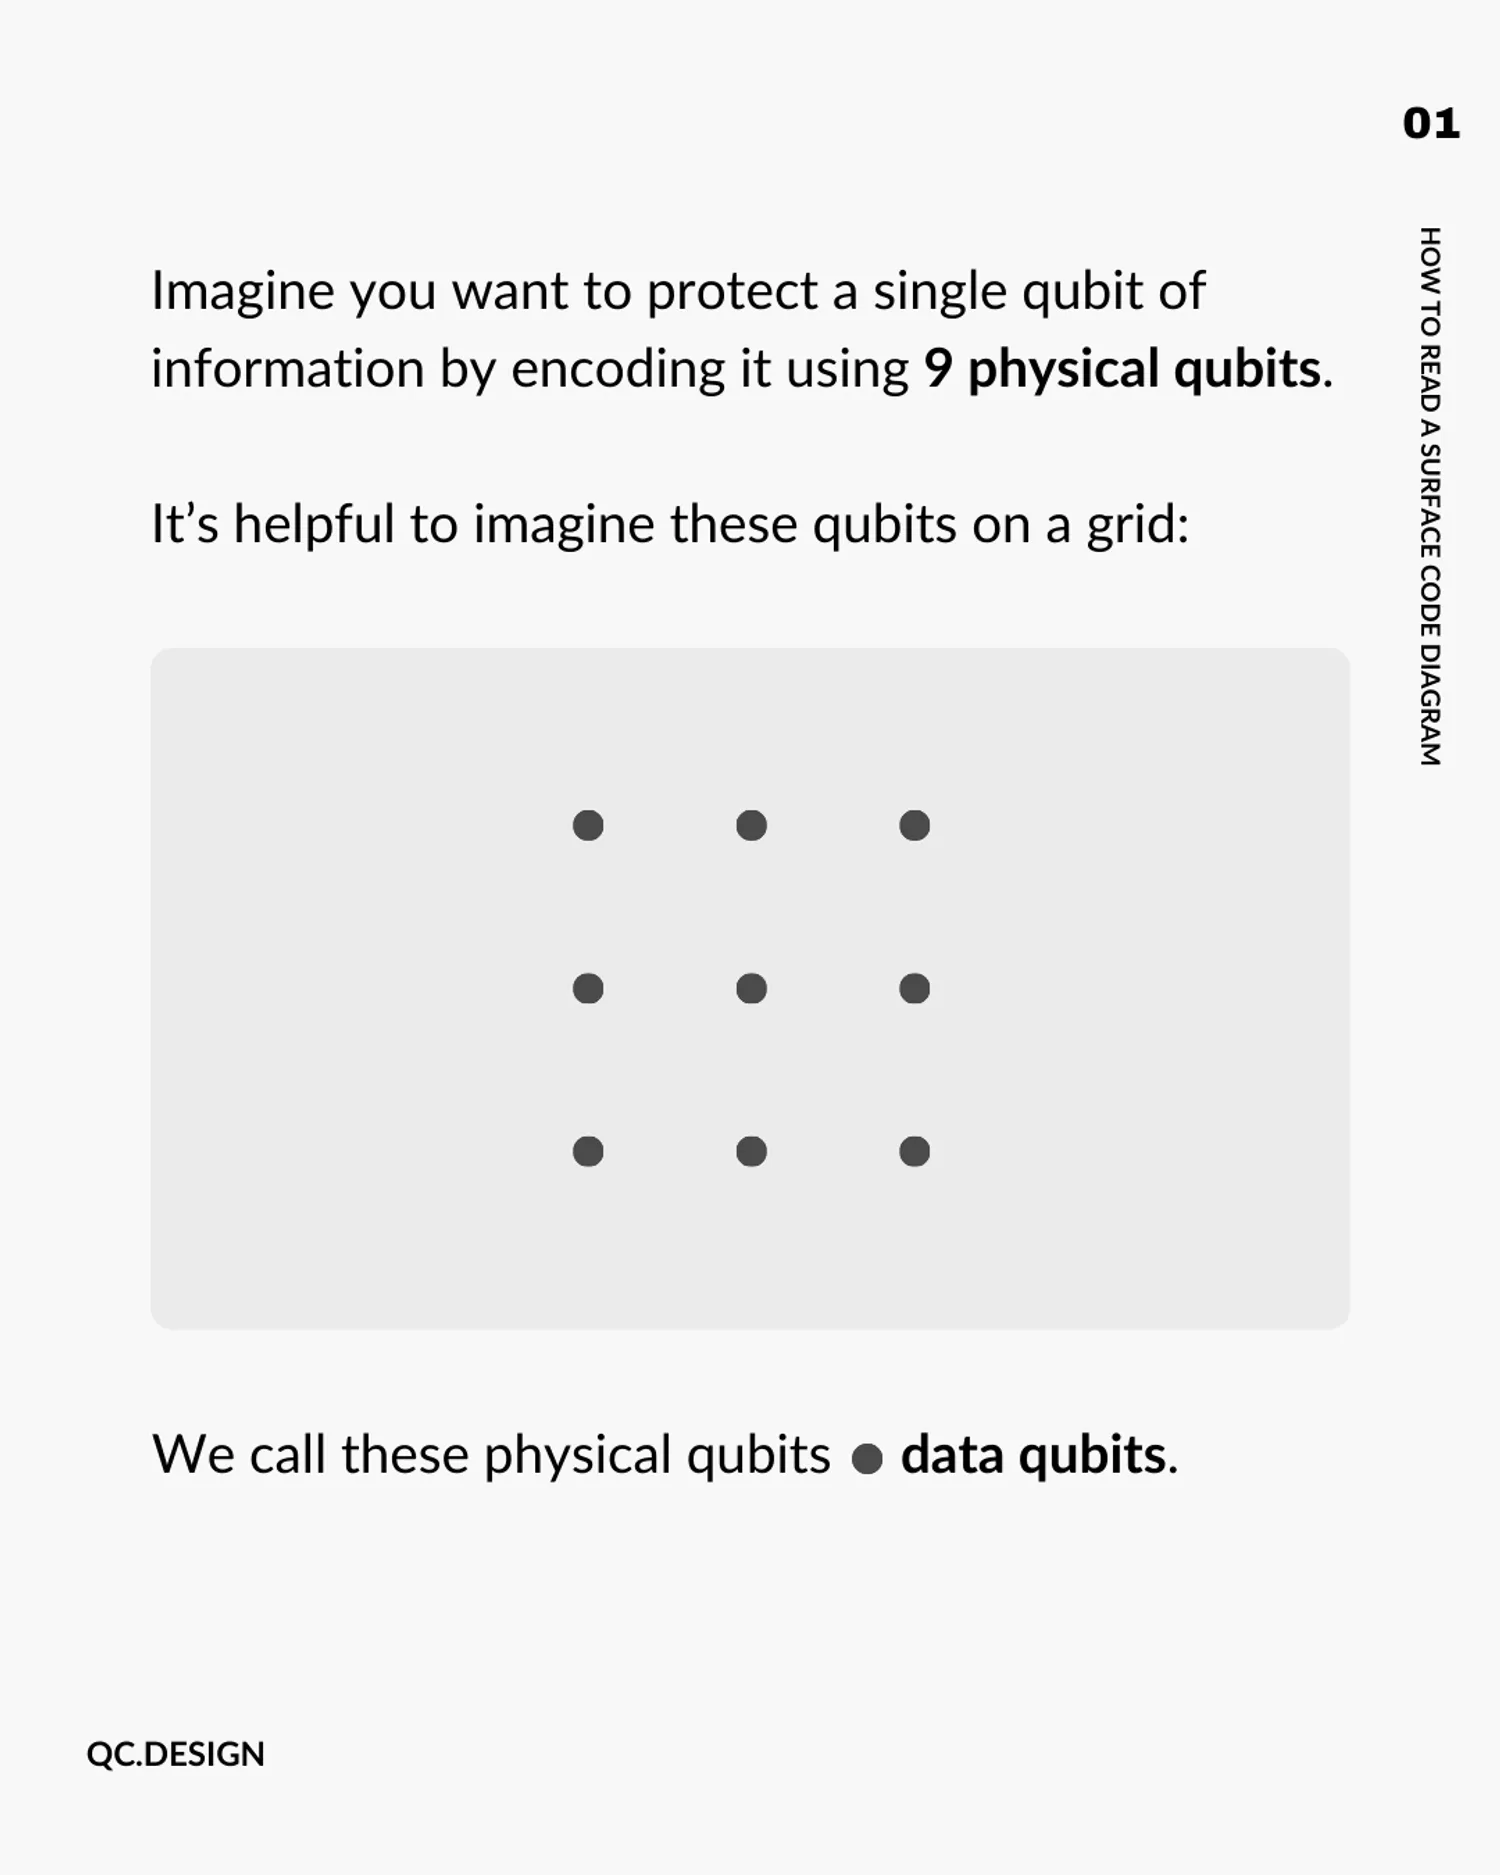
Say you want to protect a single qubit of quantum information. In a quantum error correction code, you do this by spreading that information across multiple physical qubits.
Let’s consider the surface code, for the case where there are 9 of these physical qubits.
It helps to picture these qubits arranged on a grid:

We call these physical qubits data qubits. These data qubits collectively hold the encoded quantum information.
Errors
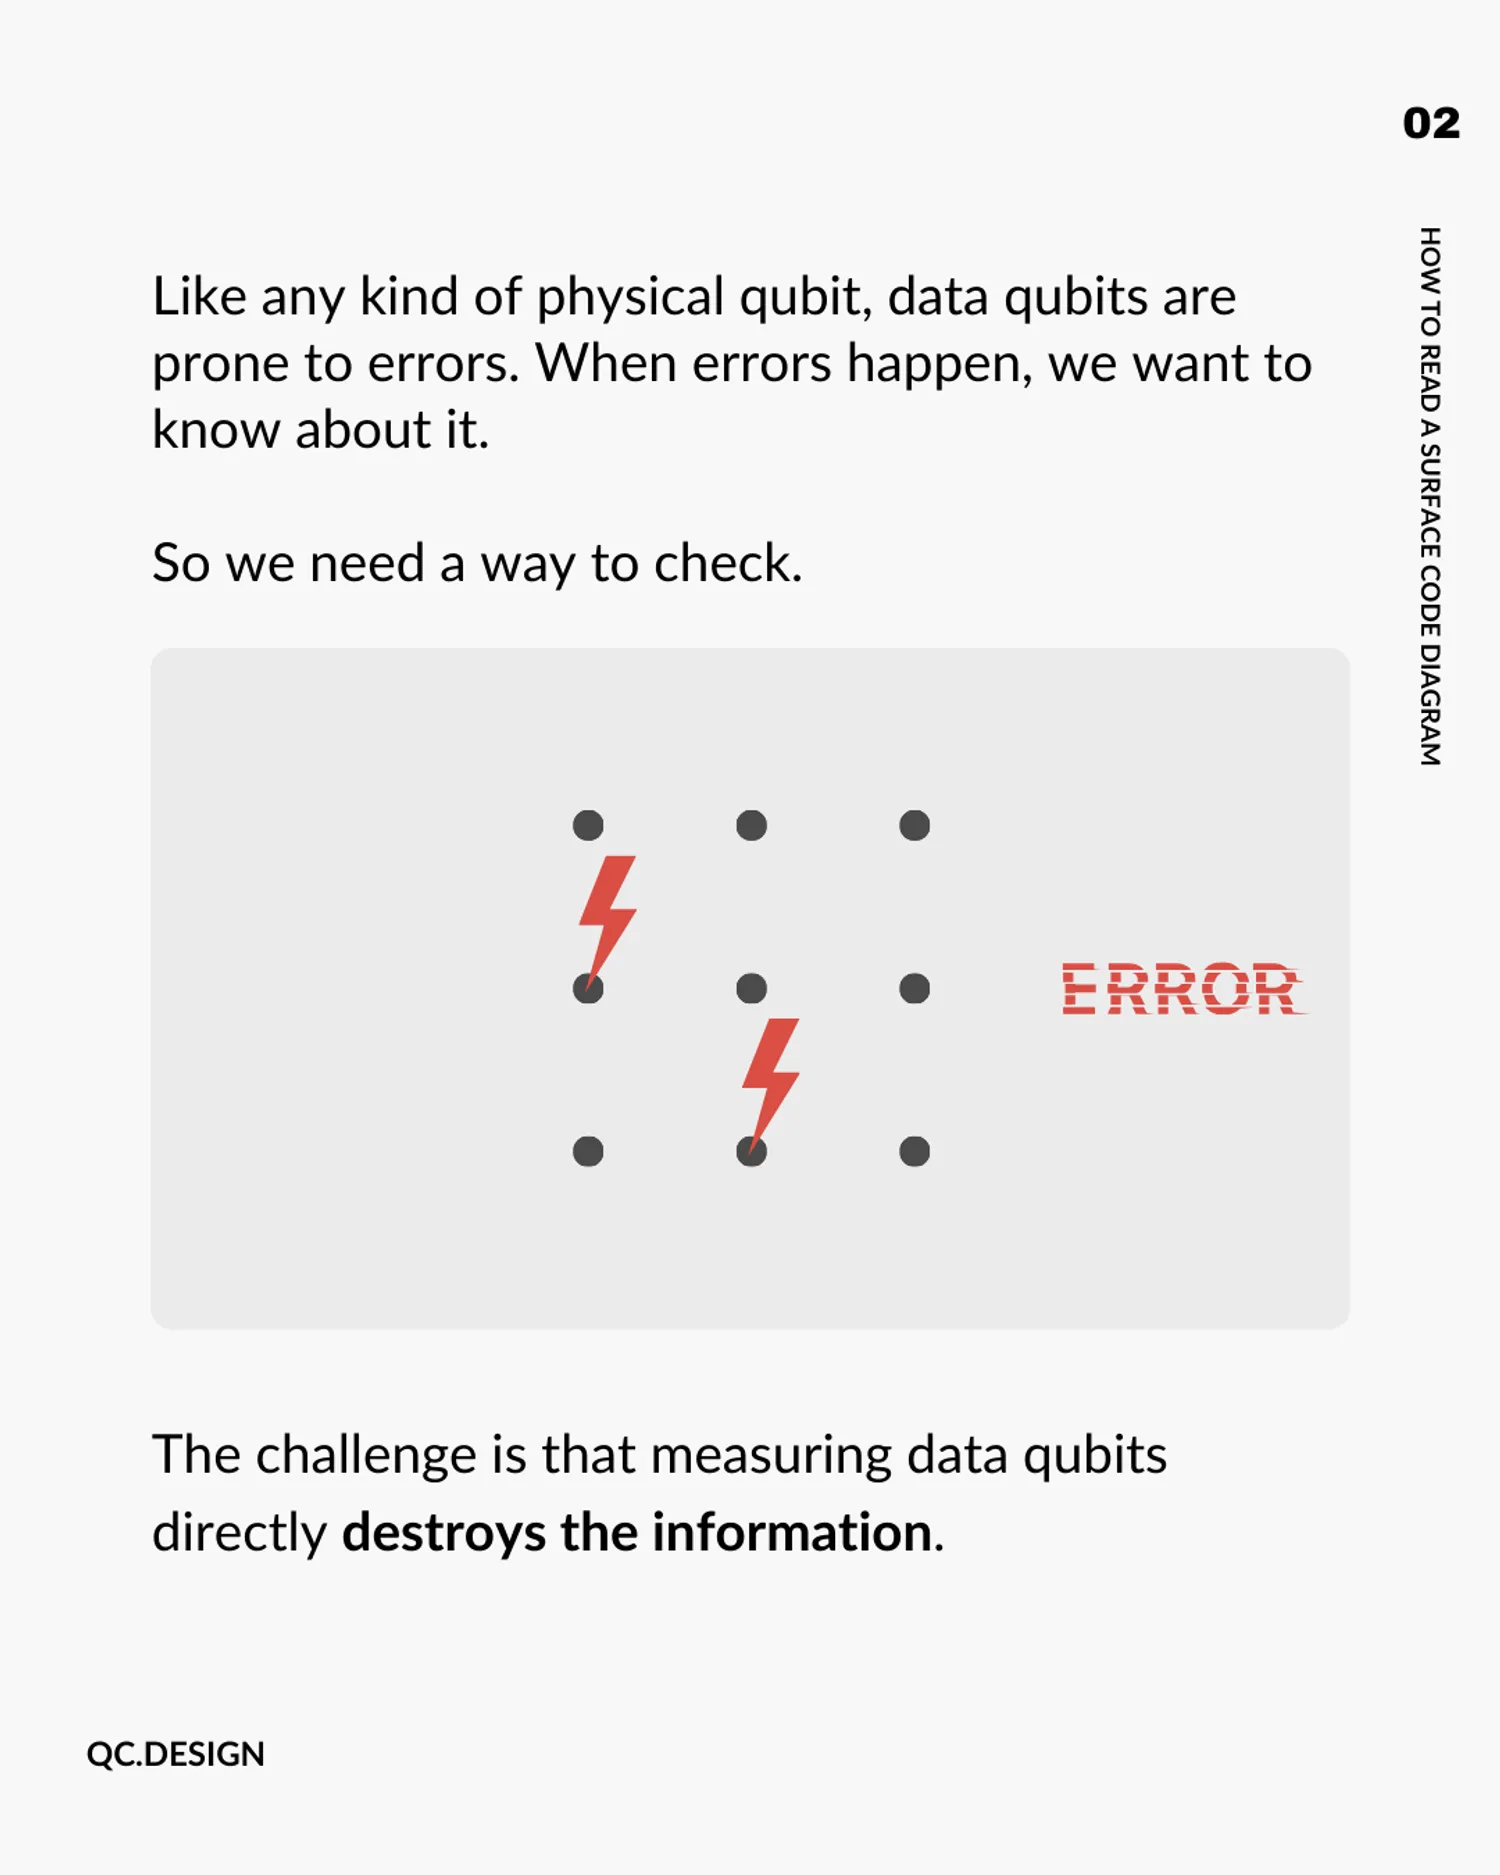
Like any kind of physical qubit, data qubits are prone to errors.

When errors happen, we want to know about it, so we need a way to check.
The challenge is that measuring a data qubit directly destroys the quantum information it carries. So we need an indirect way to check for errors.
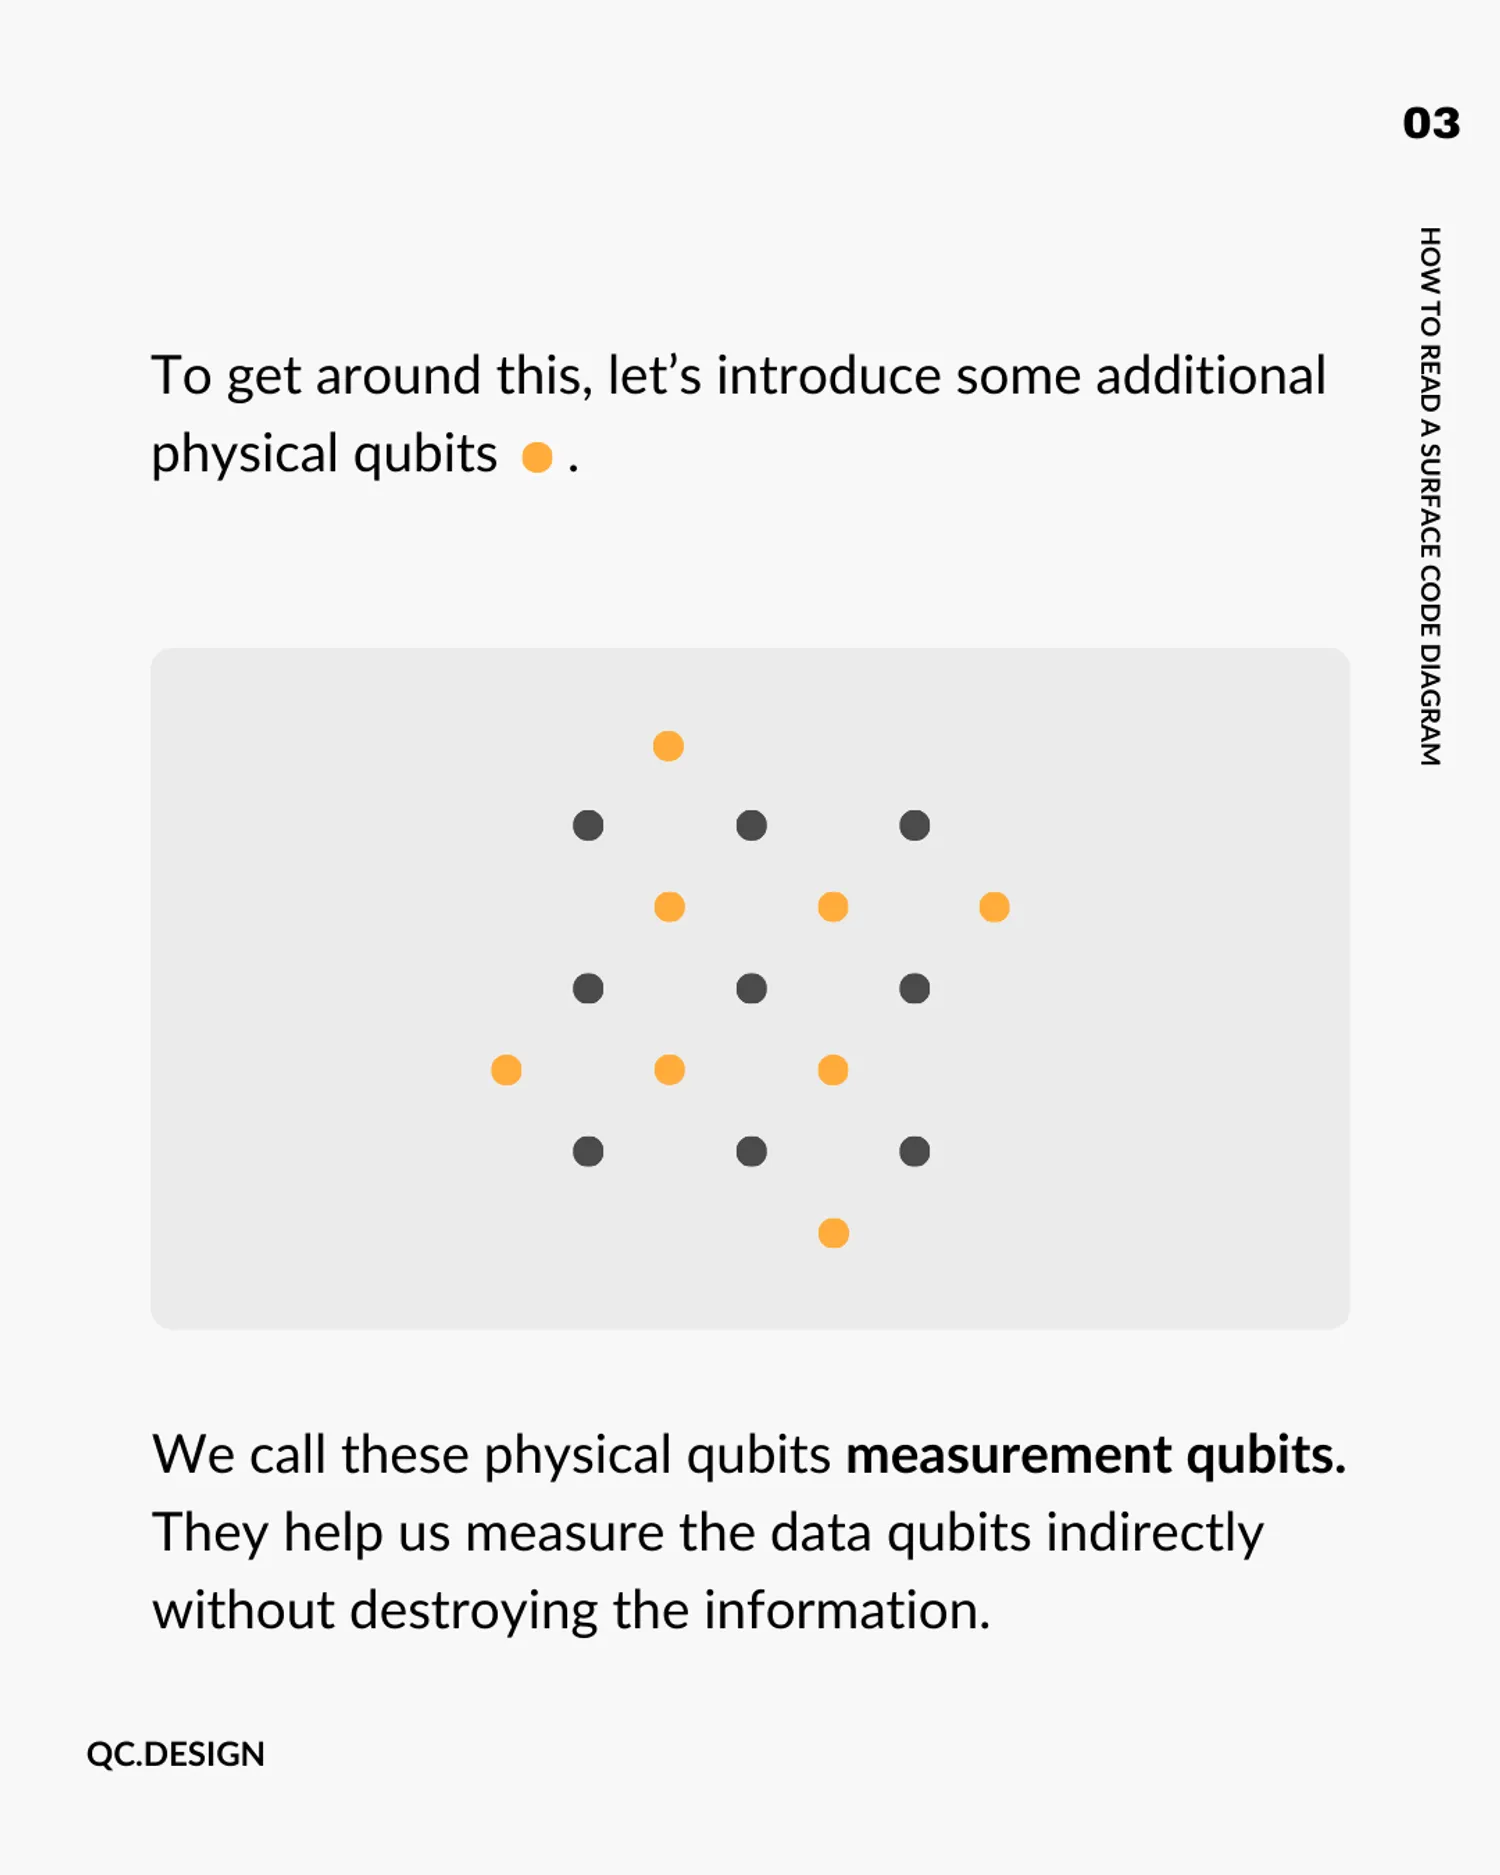
That’s where we introduce additional physical qubits, shown here as yellow dots:

We call these physical qubits measurement qubits (or sometimes ancilla or syndrome qubits). Their job is to check for errors on the nearby data qubits, without disturbing the encoded information.
Measurement
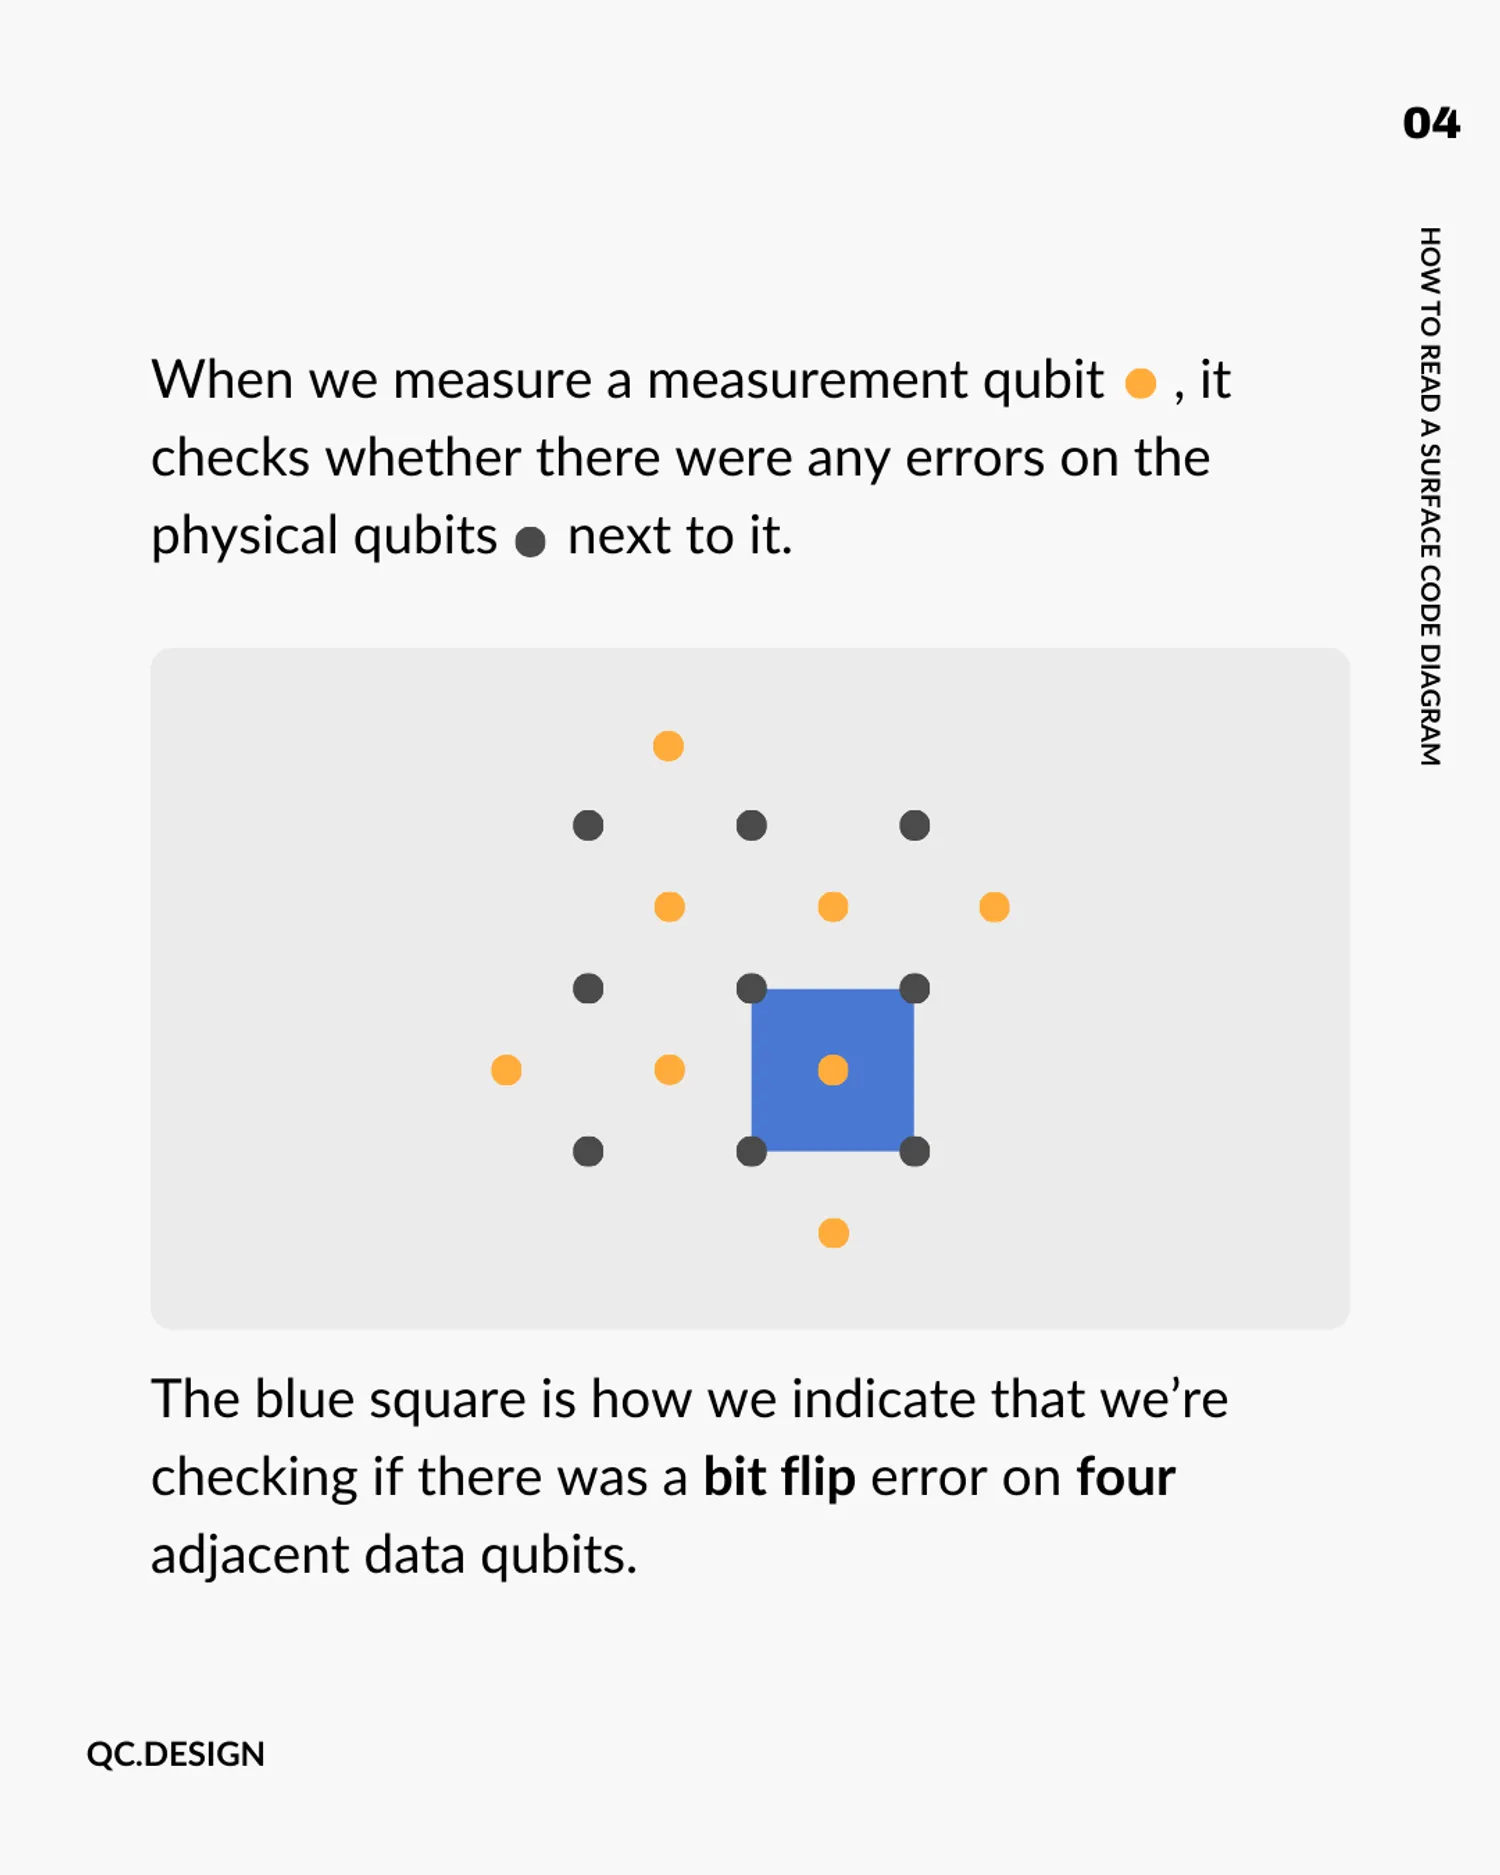
Each measurement qubit checks a specific group of neighboring data qubits. The diagram uses shapes and colors to tell you what kind of error each measurement qubit is looking for.
The shapes are determined by the geometry of the qubits in the code. The colours are left up to the person drawing the diagram to specify.

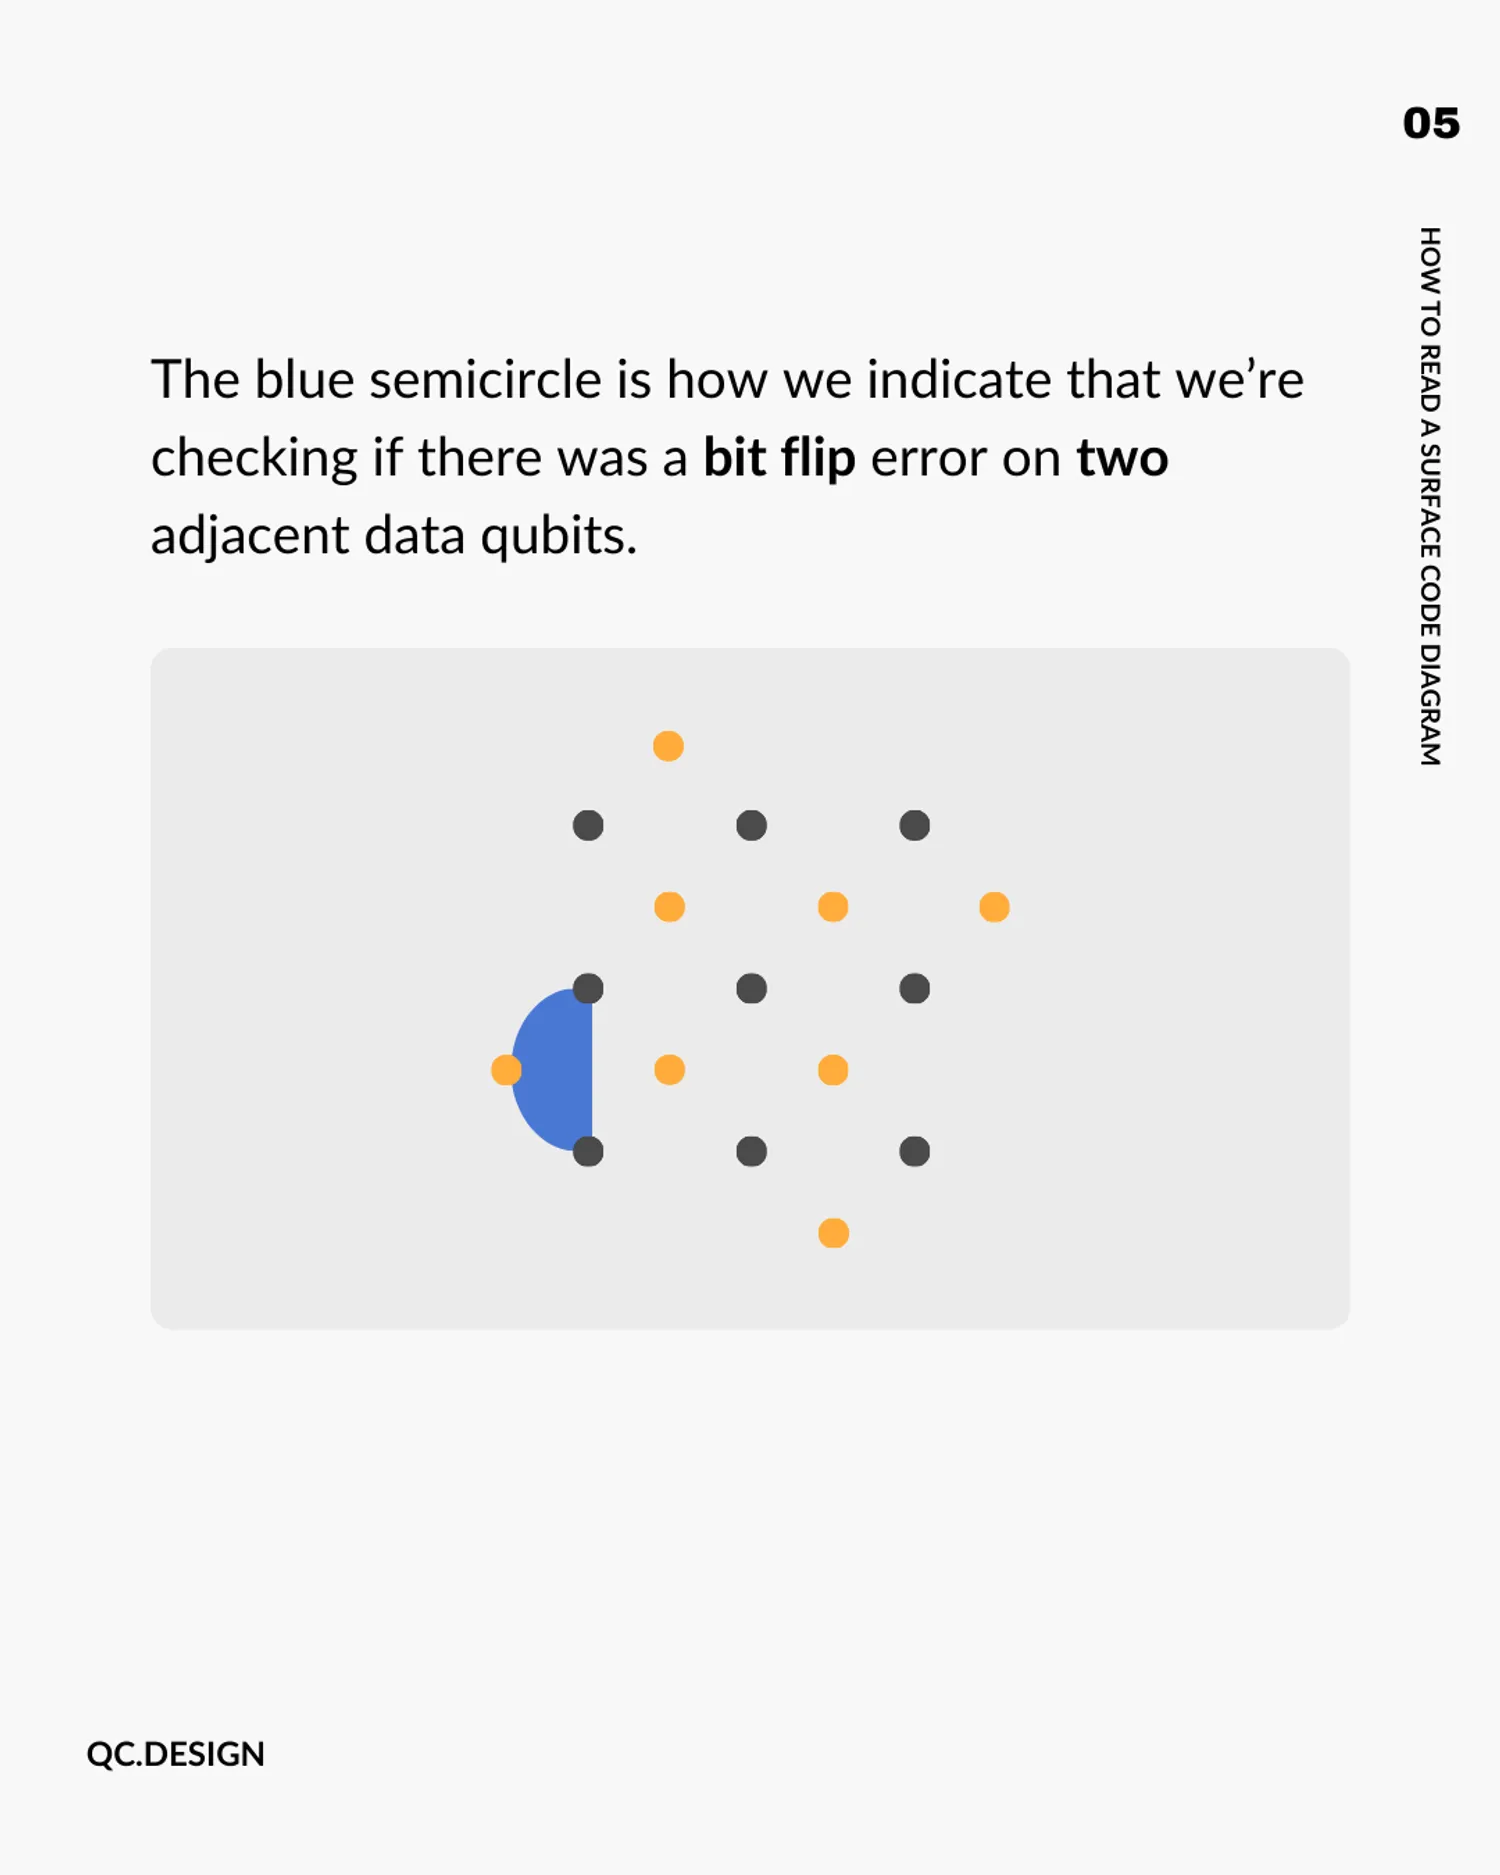
In our example, we’ll say that a blue square is how we indicate that we’re checking if there was a bit flip error on four adjacent data qubits.
A blue semicircle does the same thing, but for two adjacent data qubits. You’ll see these on the edges of the grid where there aren’t four neighbors to check.

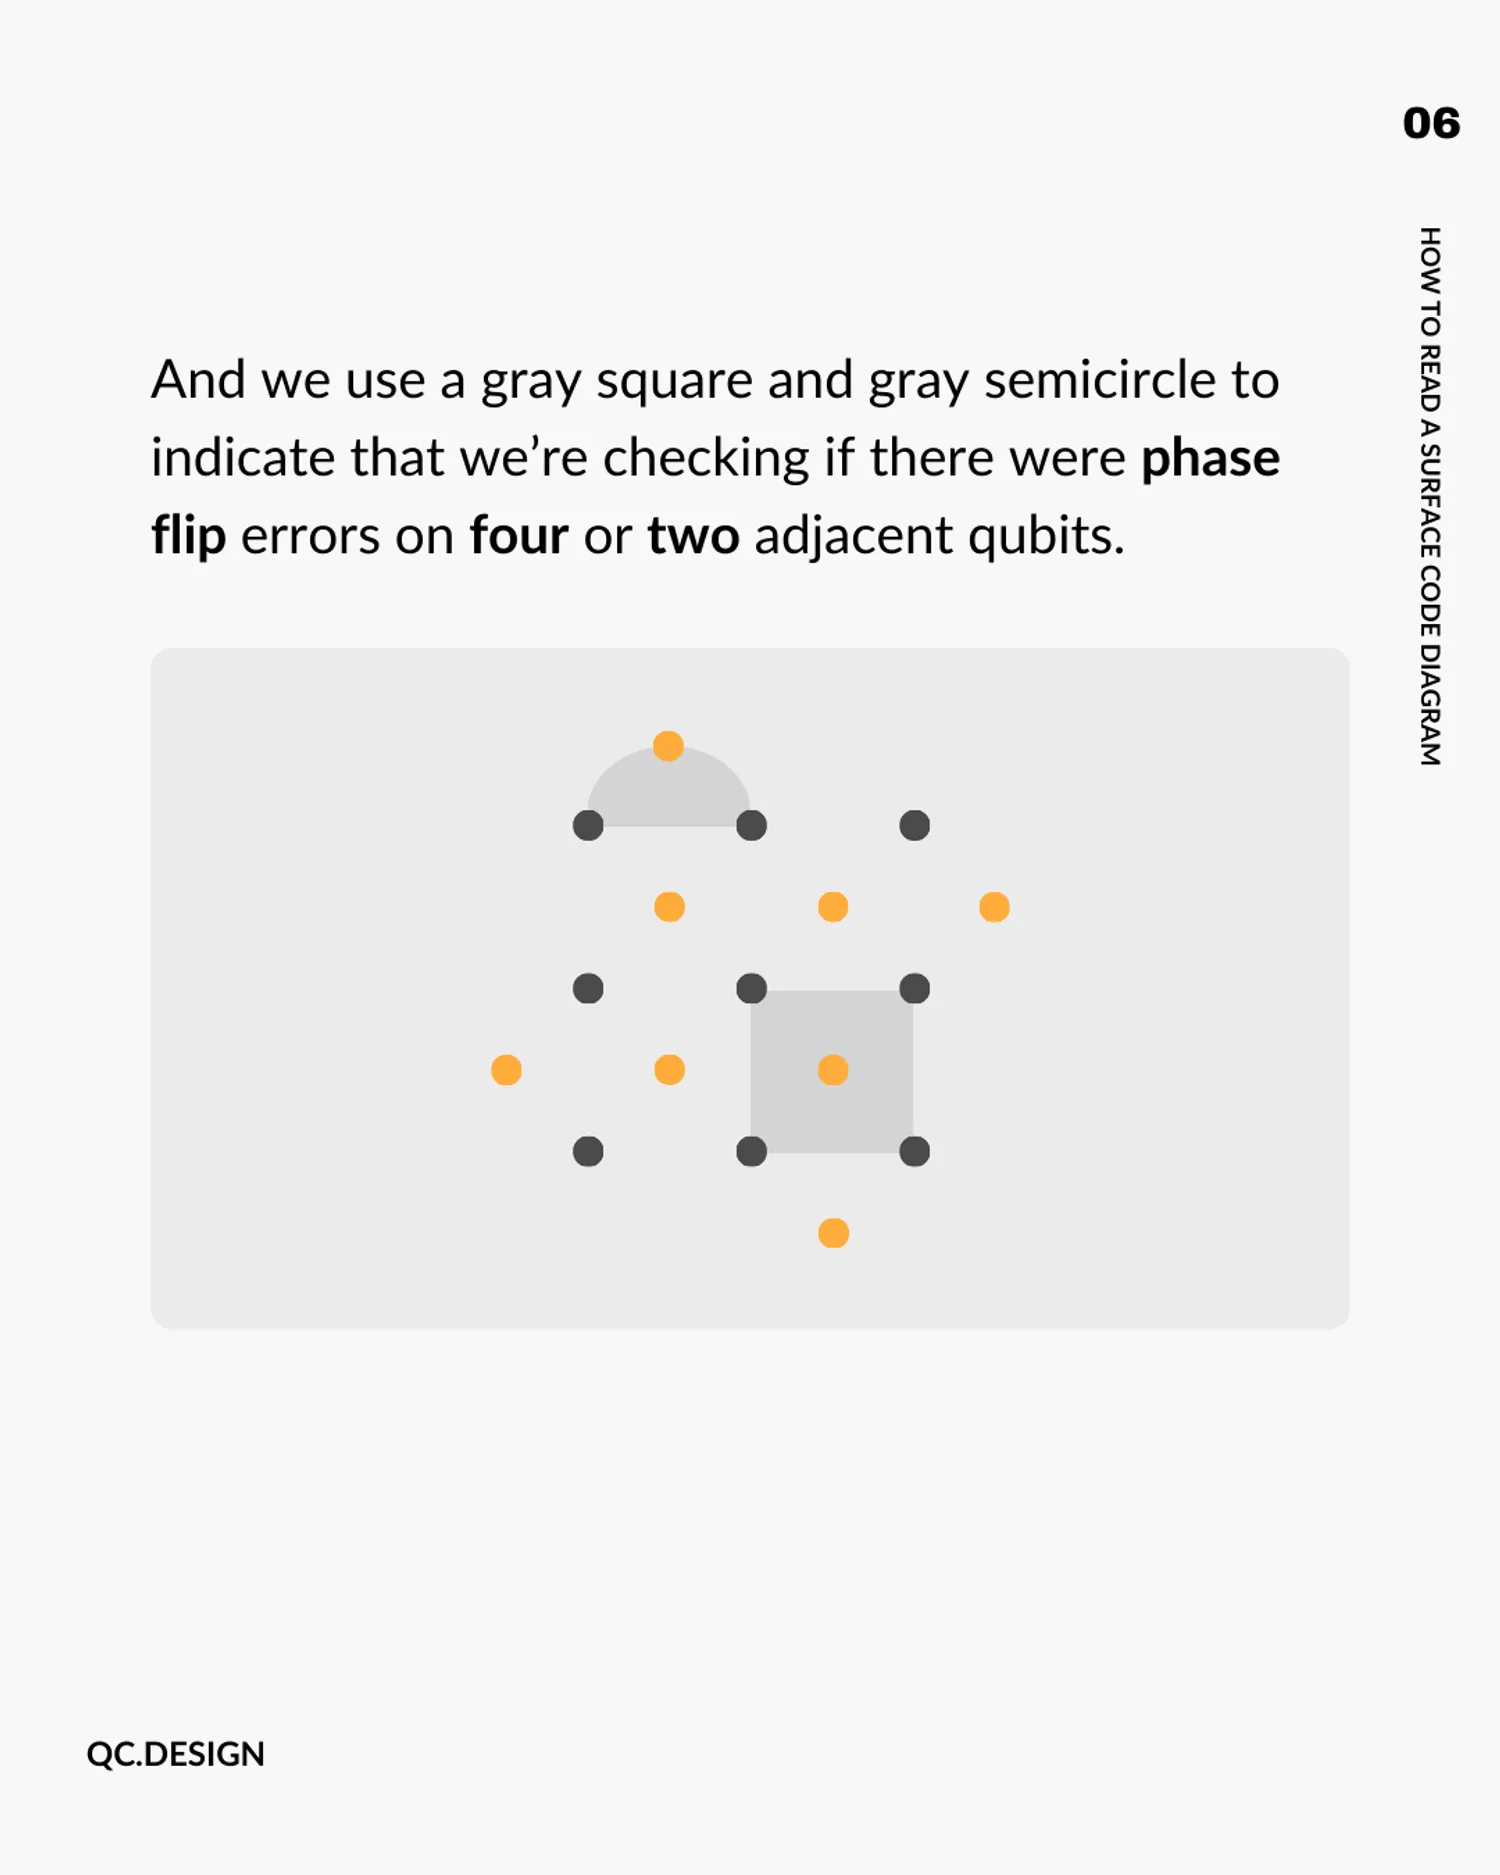
We’ll choose gray as our second colour, so that gray squares and gray semicircles indicate checks for phase flip errors on four or two adjacent data qubits, respectively.

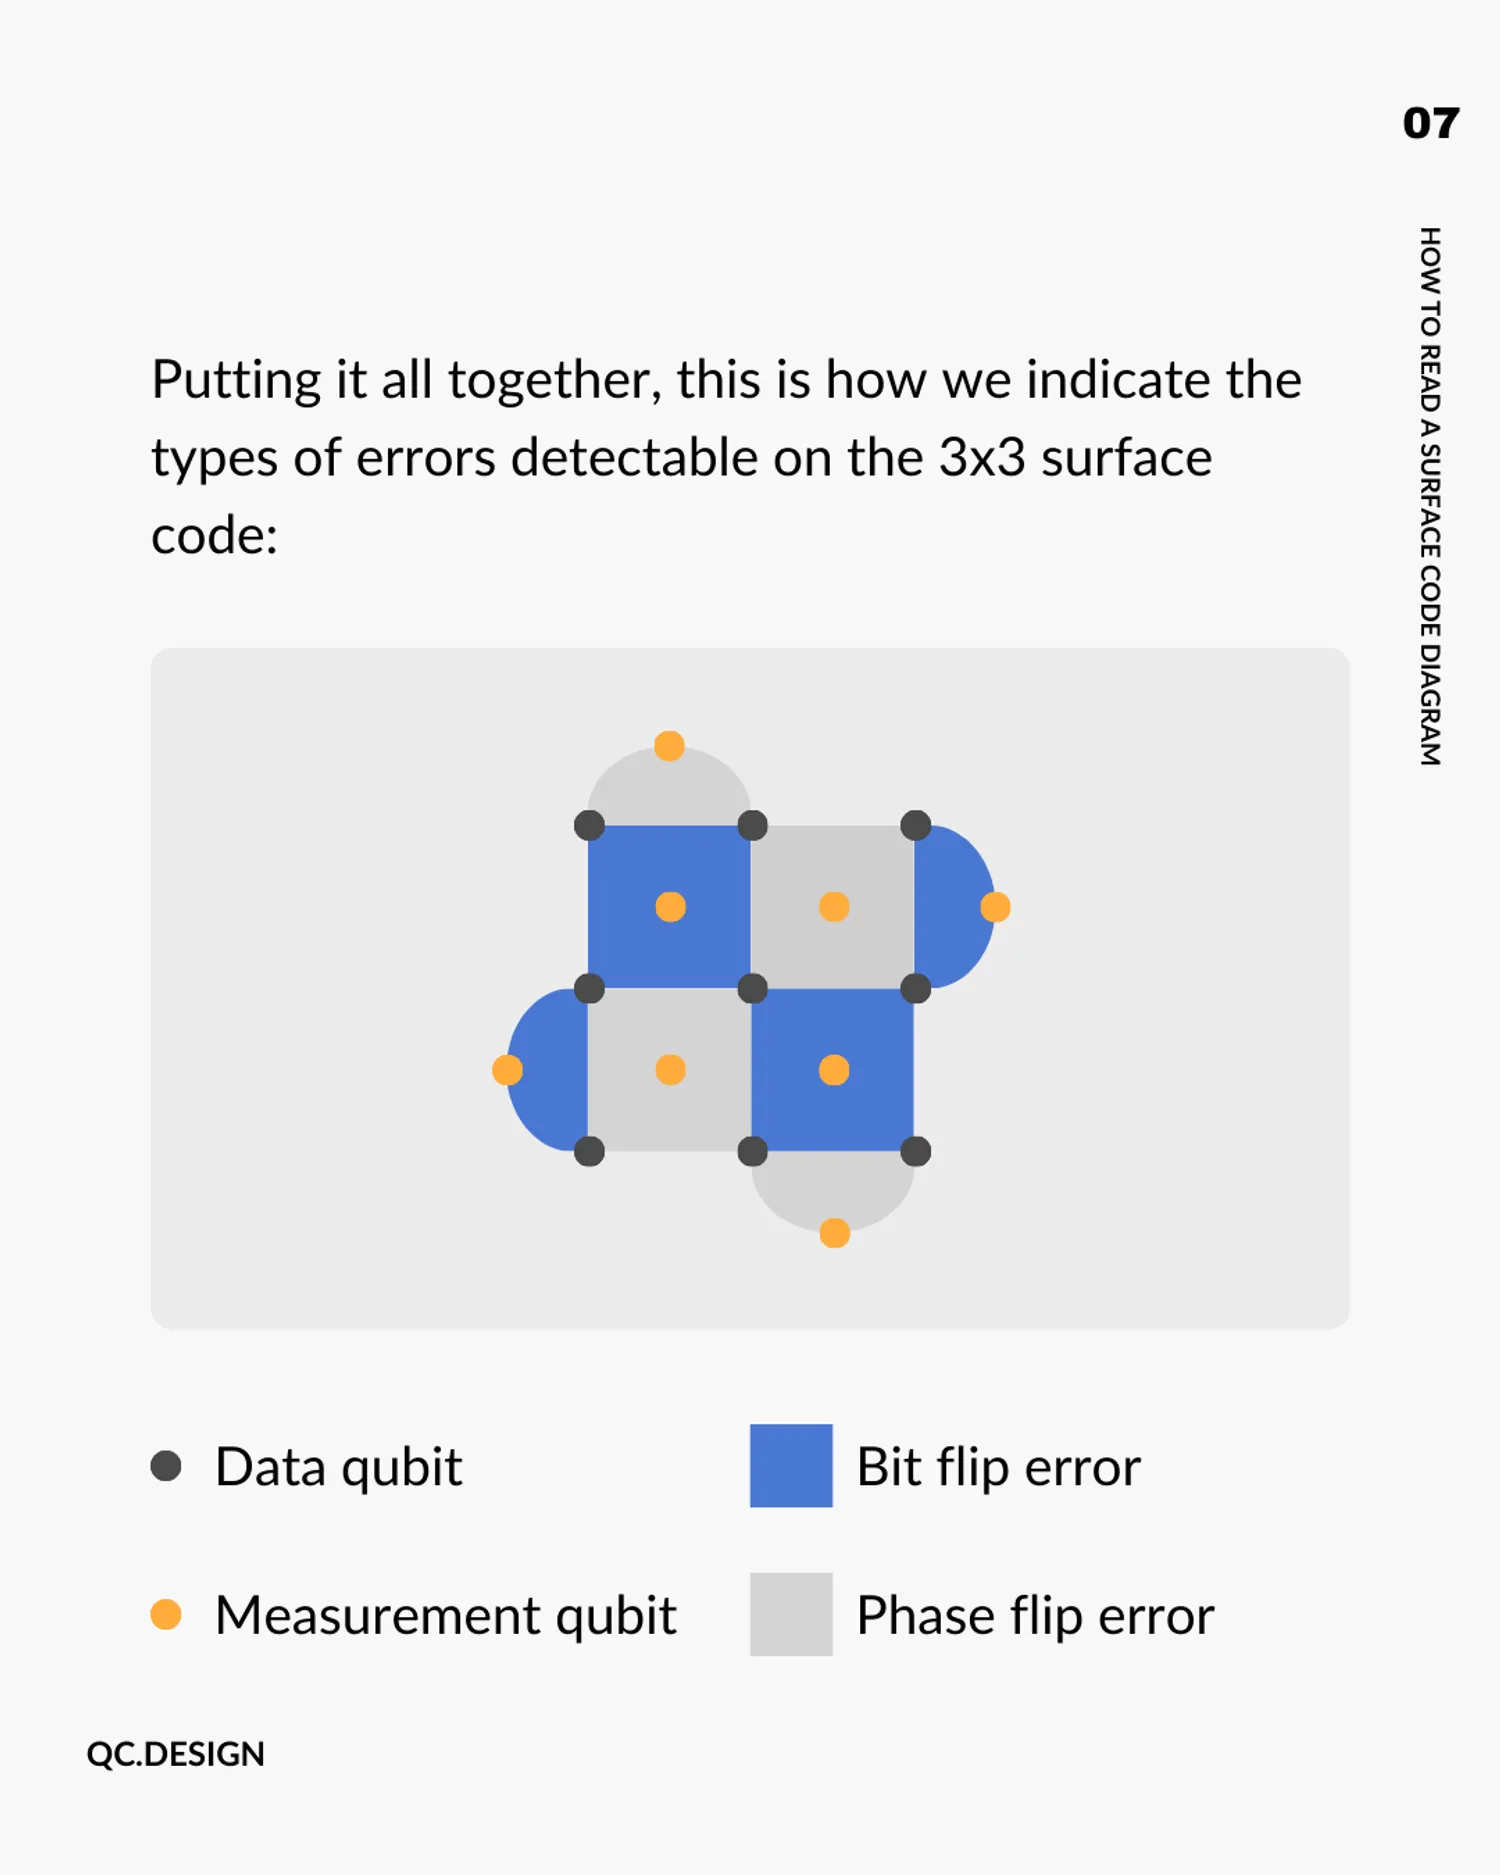
Putting it all together, here’s the full diagram for a 3x3 (a.k.a. distance-3) surface code, showing all the checks that make errors detectable:
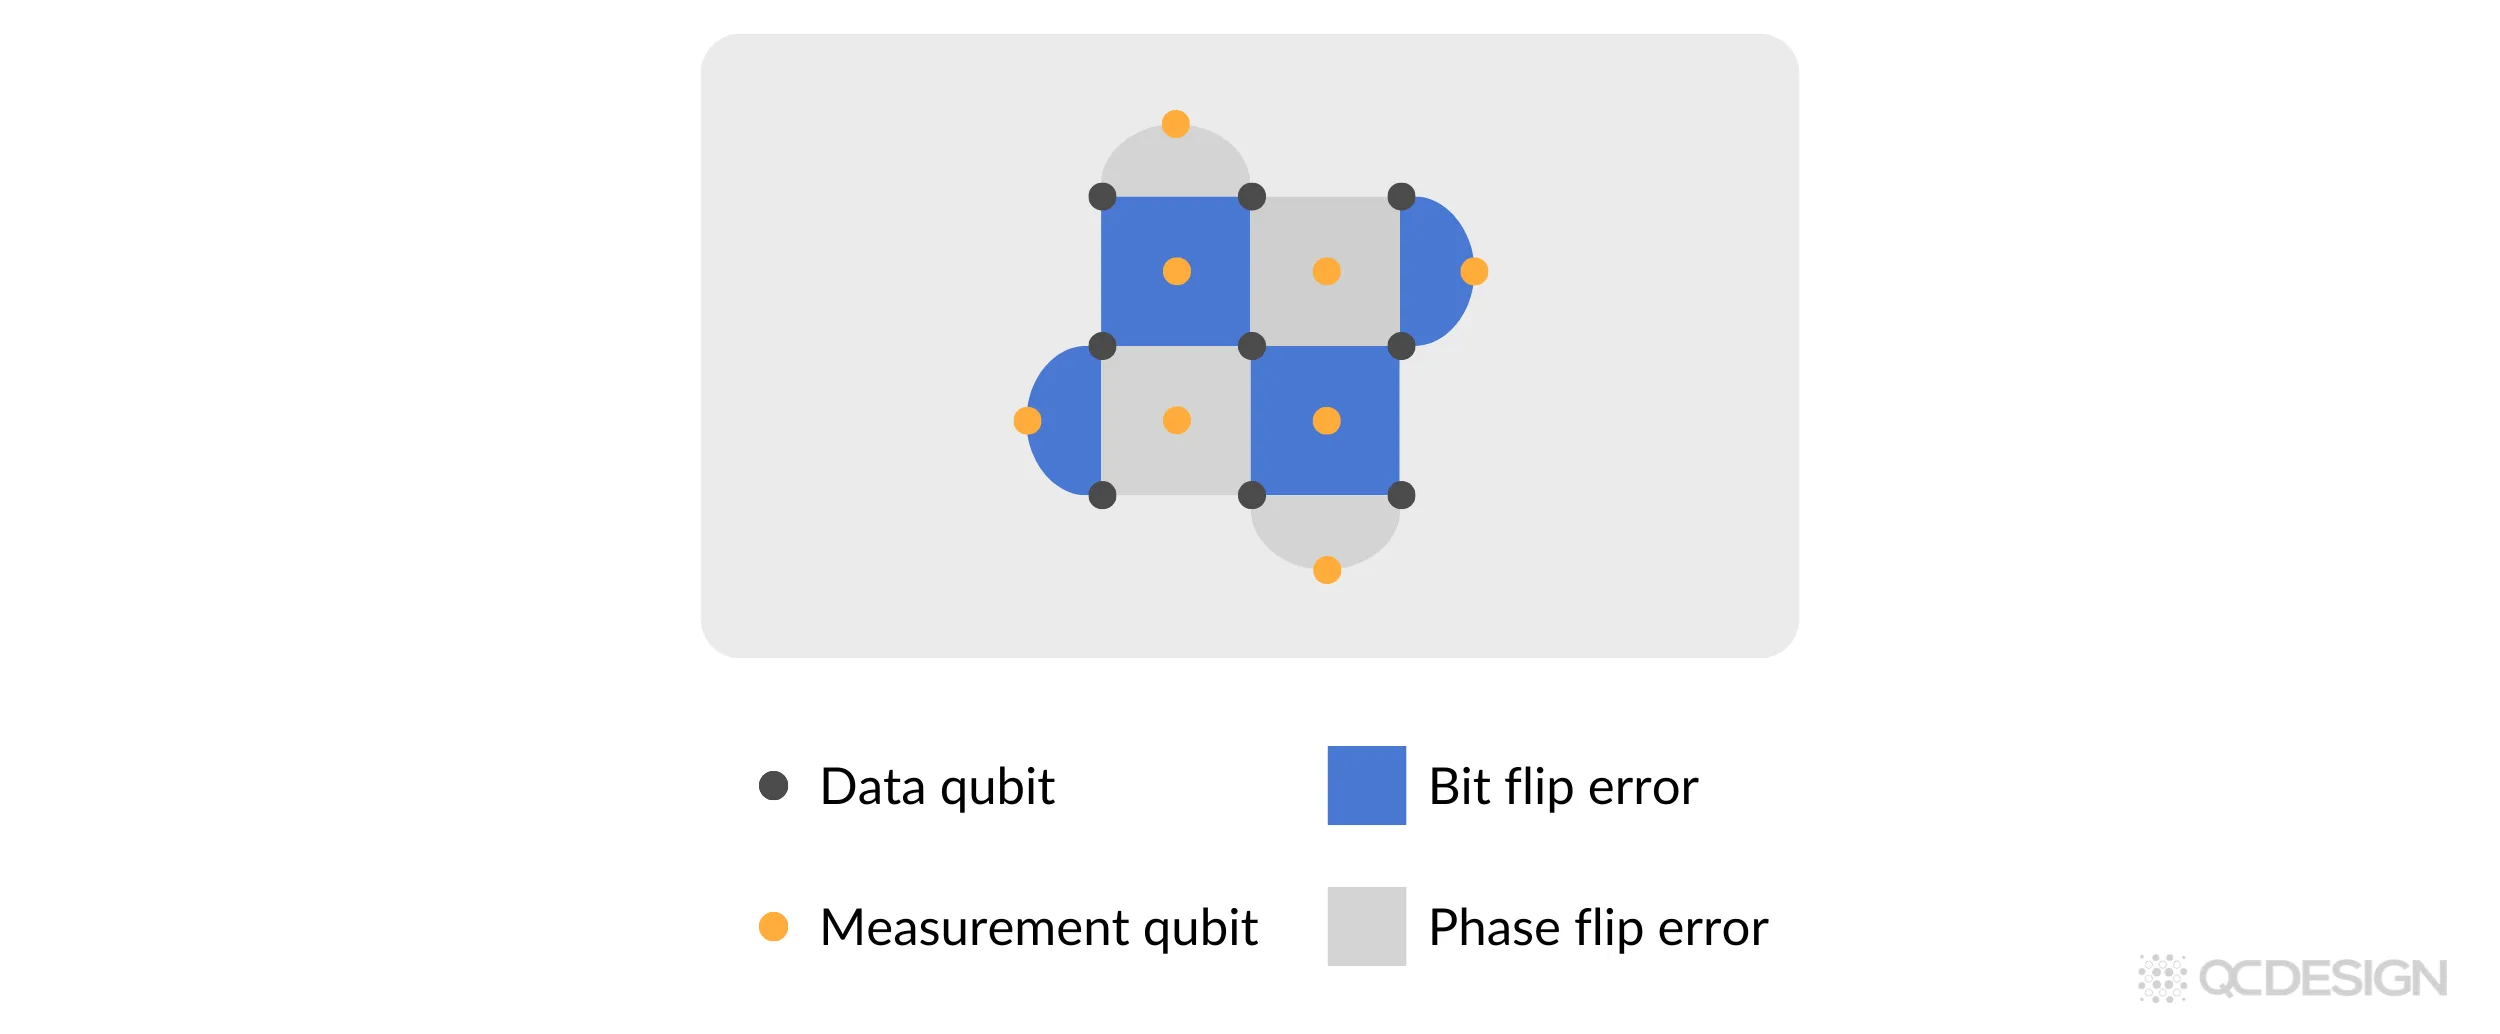
Each shape in this diagram corresponds to what’s known as a stabilizer measurement. It flags whether an error has occurred in its neighborhood, without revealing (or disturbing) the actual quantum state.
Why this matters
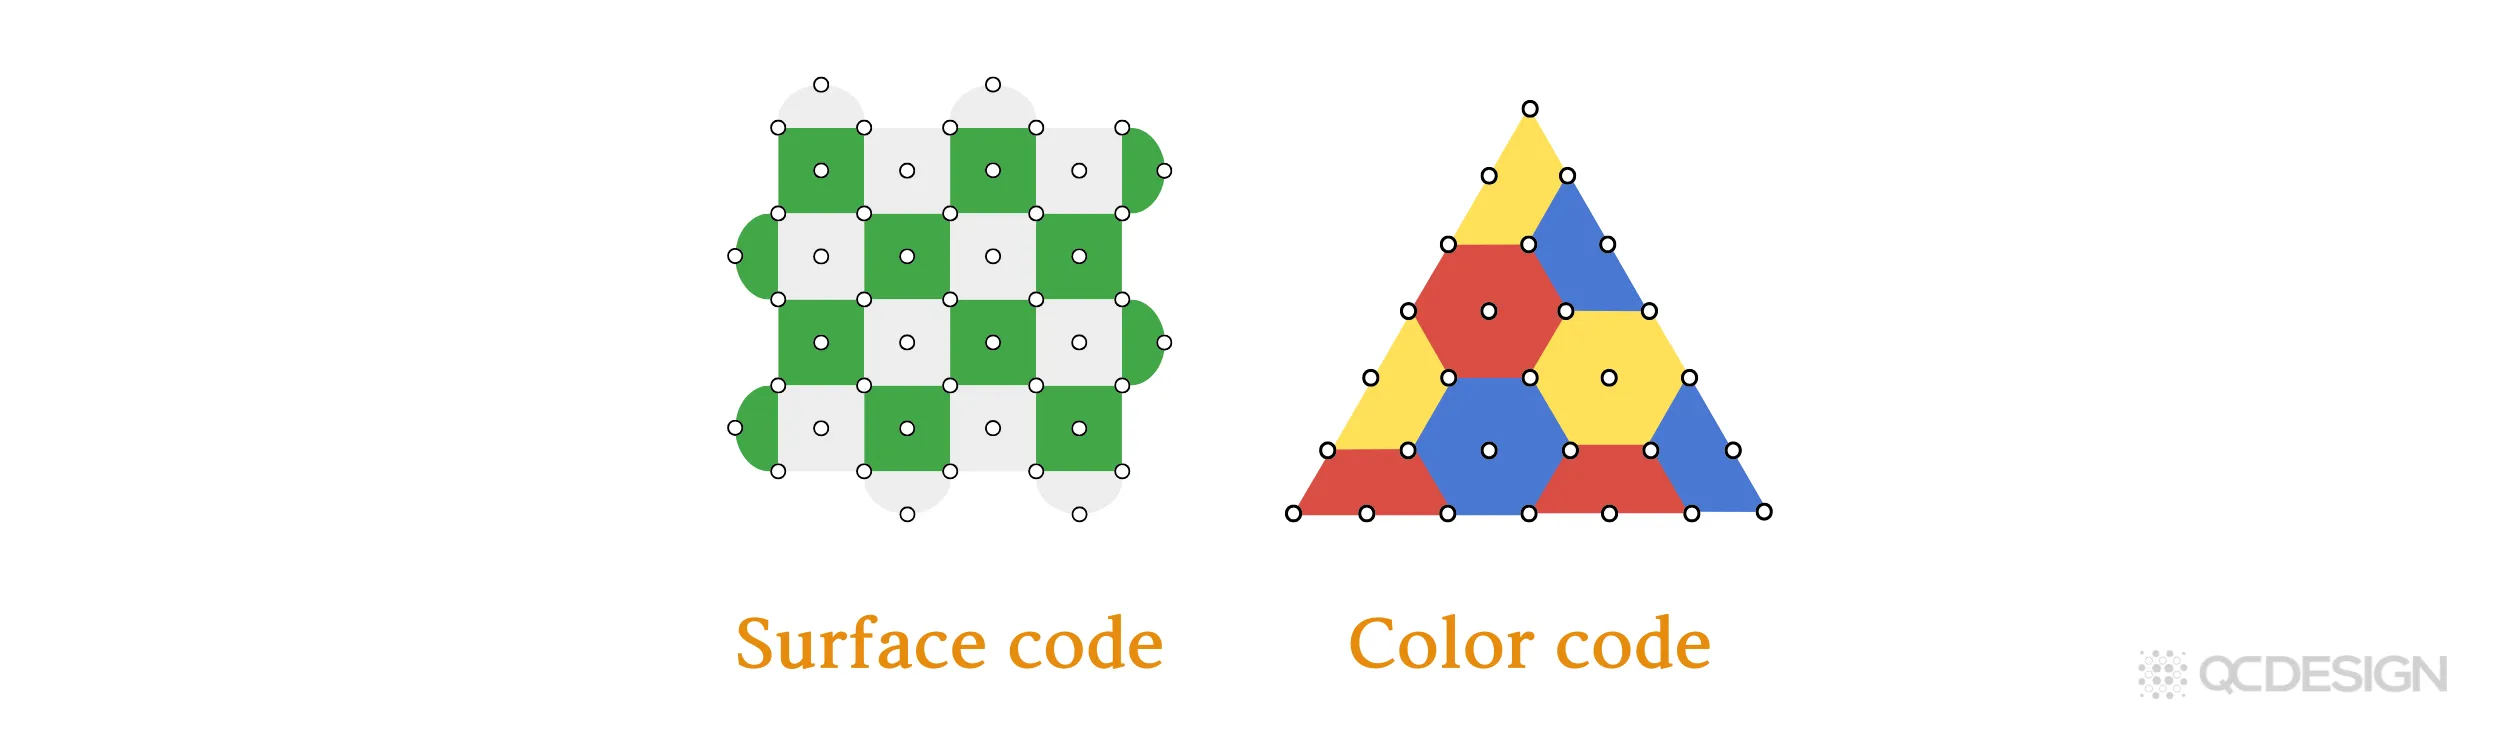
Every QEC code has a corresponding diagram, and learning to read these diagrams gives you immediate insight into important properties of the code:
-
Connectivity: How many qubits are connected to each other.
-
Range of interactions: Whether qubits interact with neighbors or distant ones.
Surface code diagrams are especially important for quantum hardware design. But it’s worth noting that the diagram only shows the arrangement of qubits in the code, not the full picture of how they interact over time or how the error correction protocol actually runs. For that, you need a quantum error correction circuit.
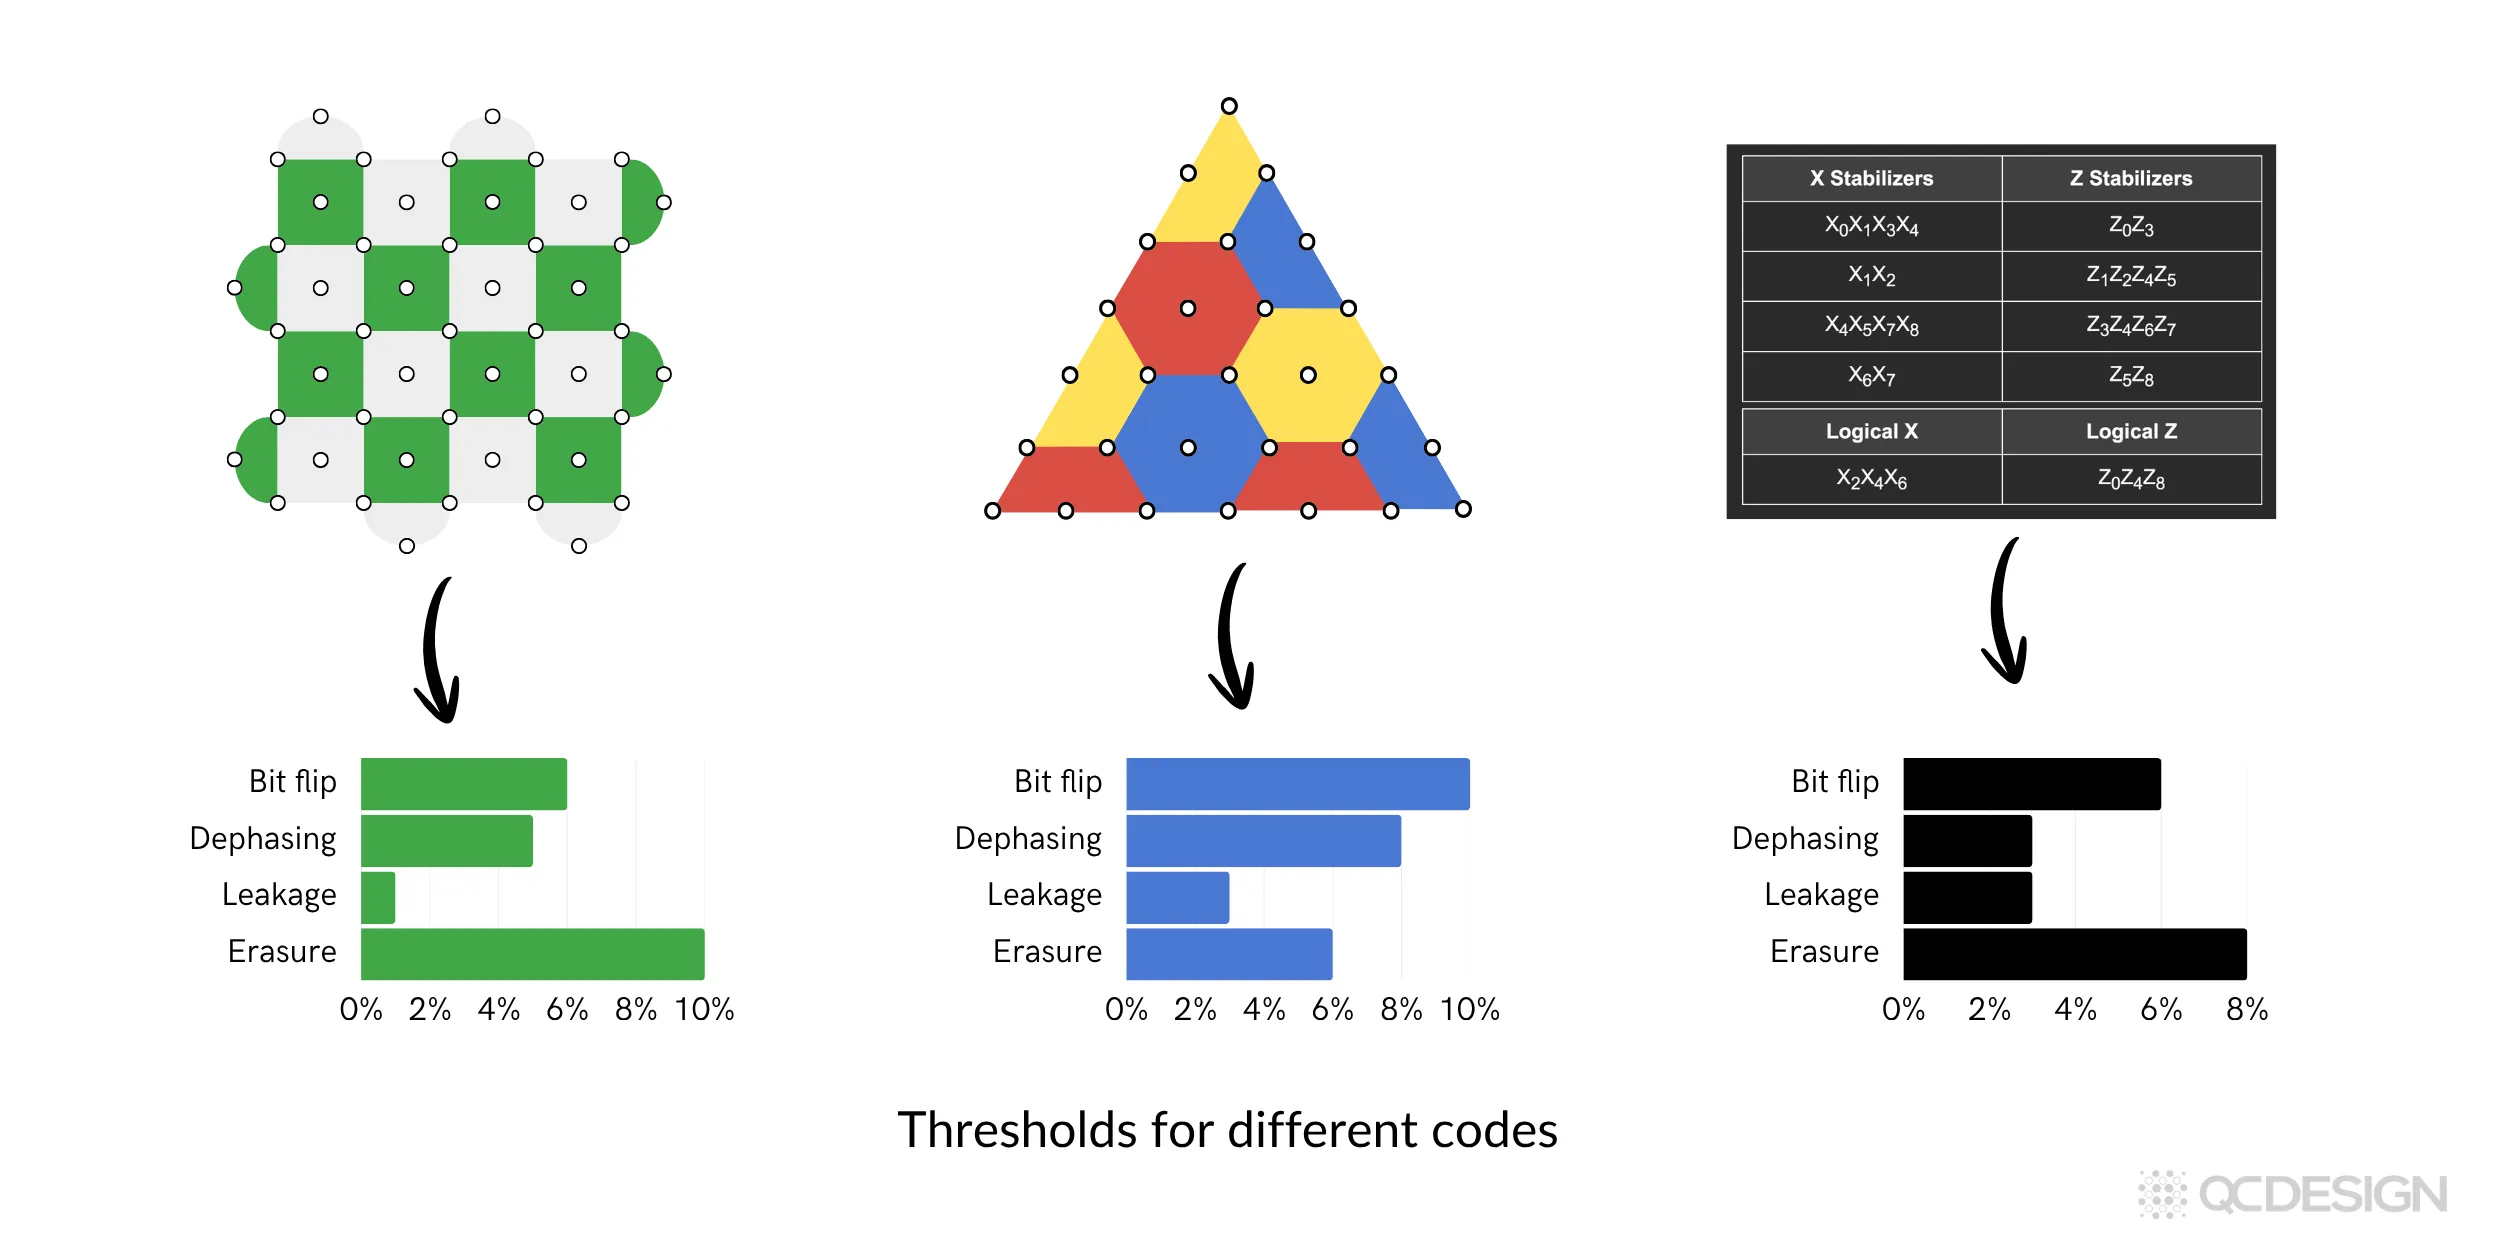
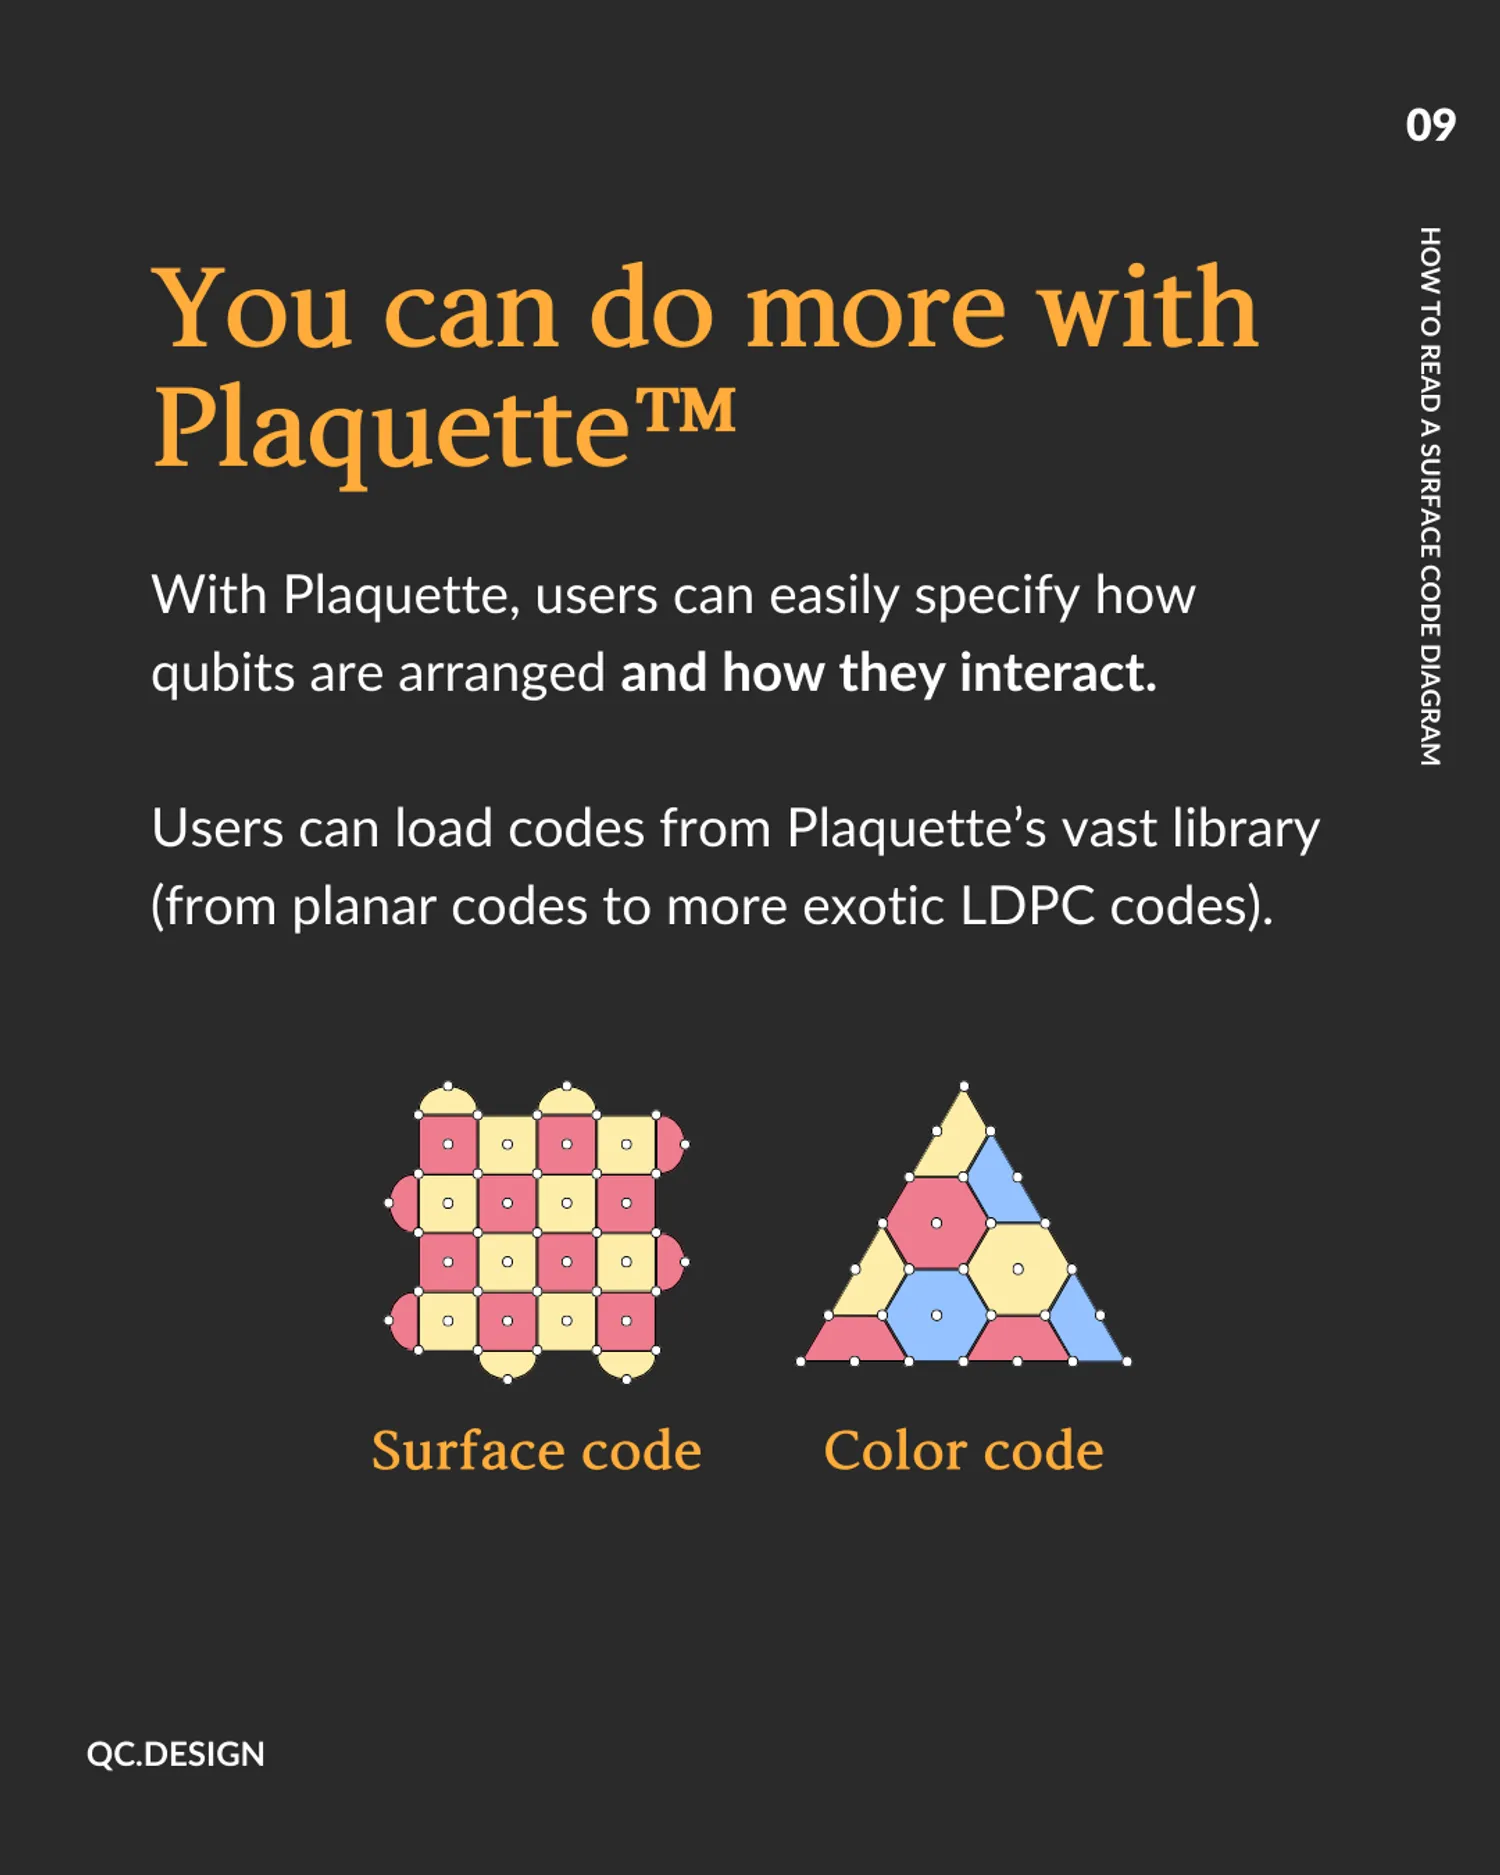
This is where Plaquette comes in. With Plaquette, users can easily specify how qubits are arranged and how they interact.
How Plaquette helps
Users can load codes from Plaquette’s vast library (from planar codes to more exotic LDPC codes).
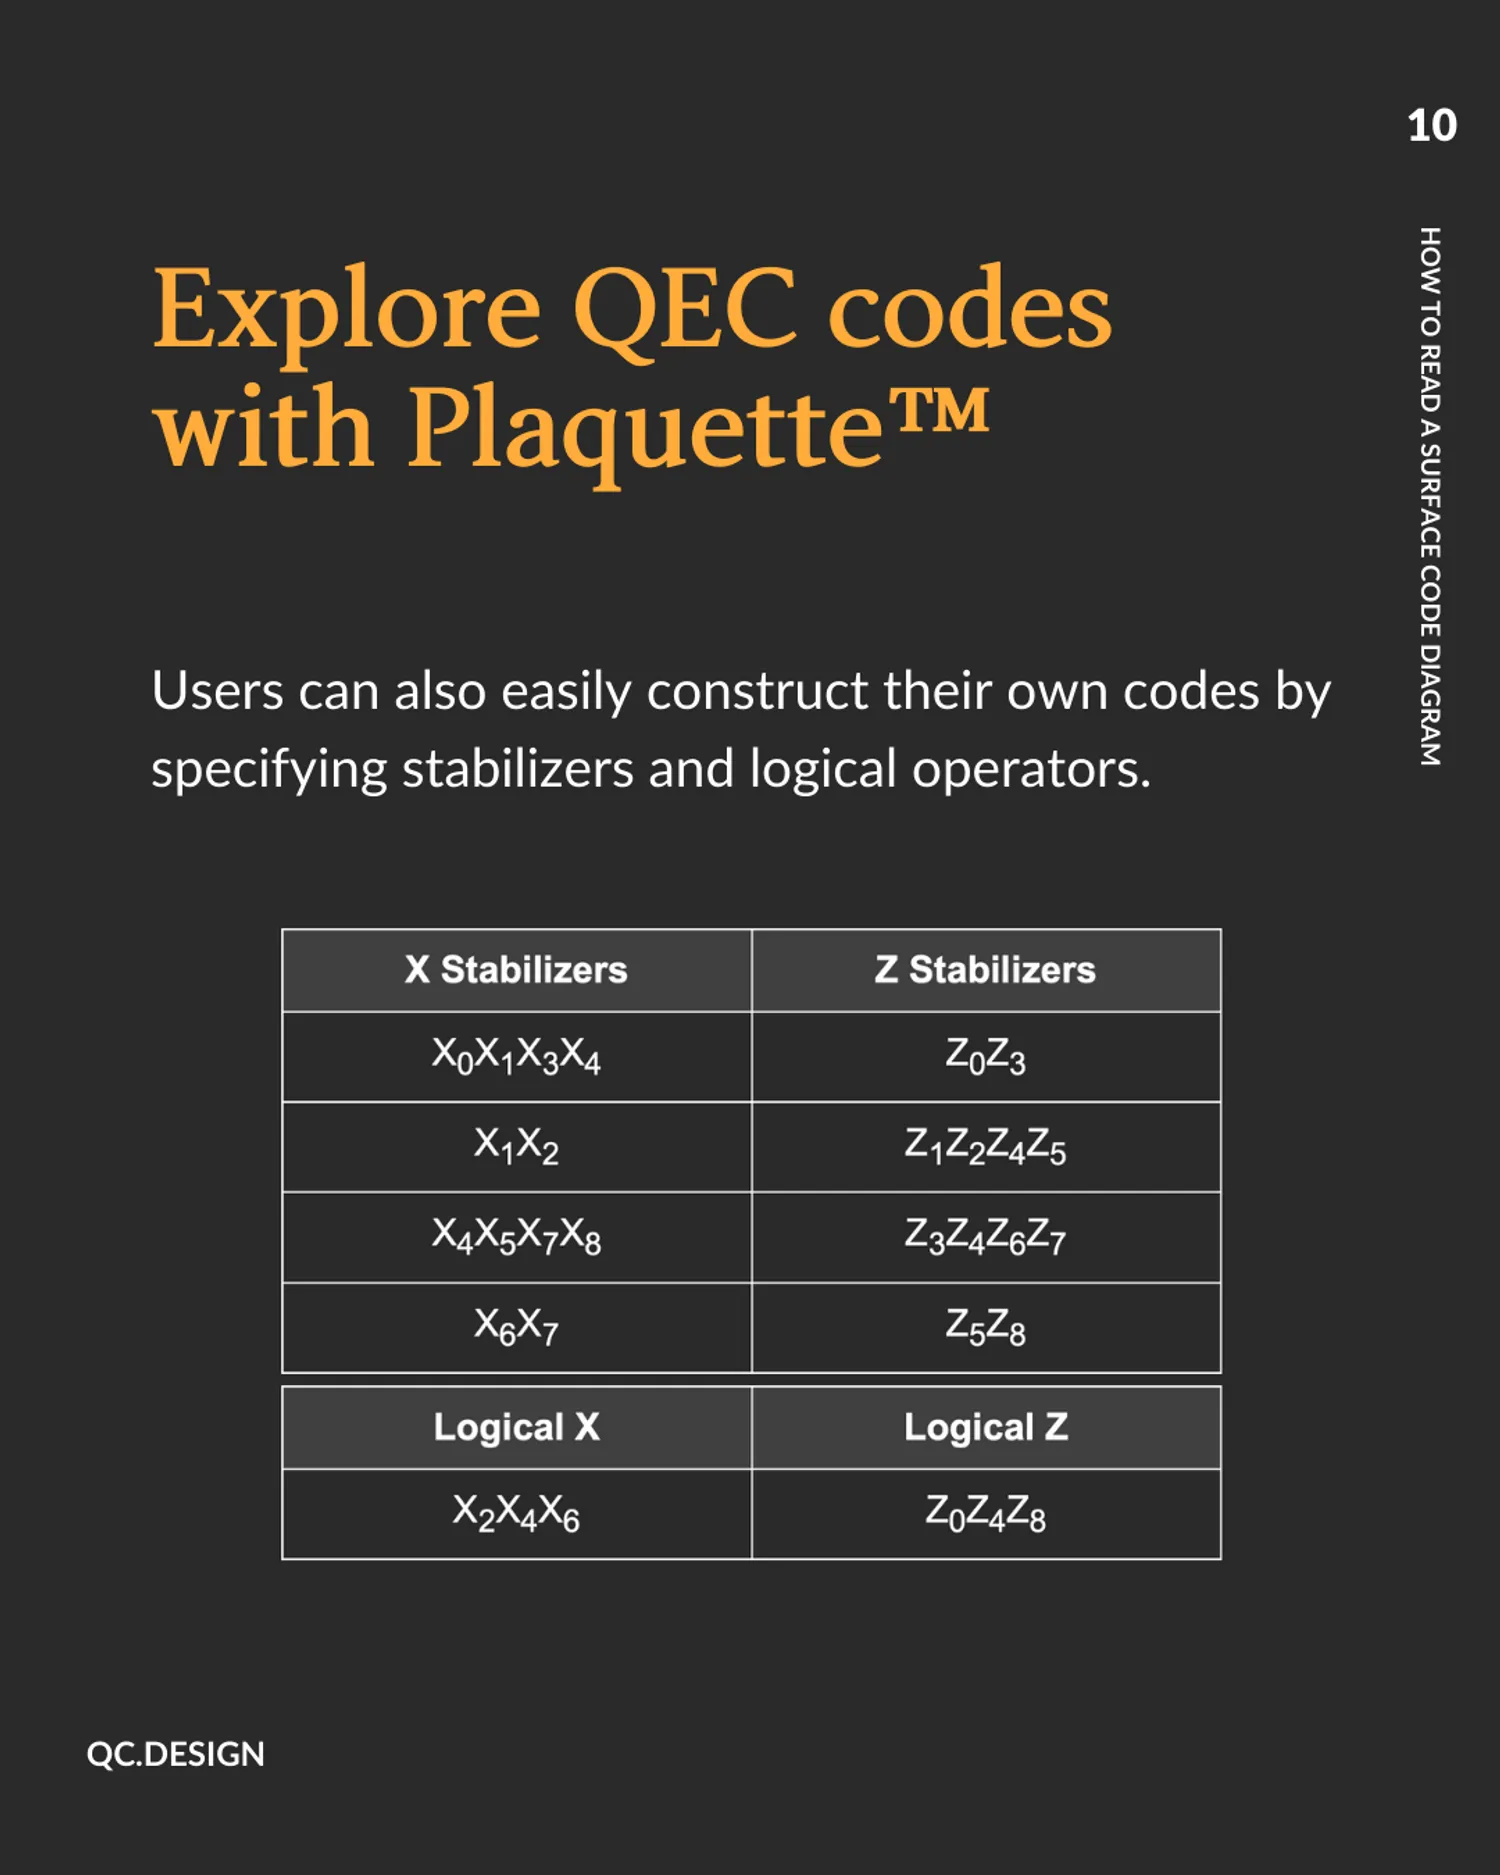
Users can also easily construct their own codes by specifying stabilizers and logical operators.

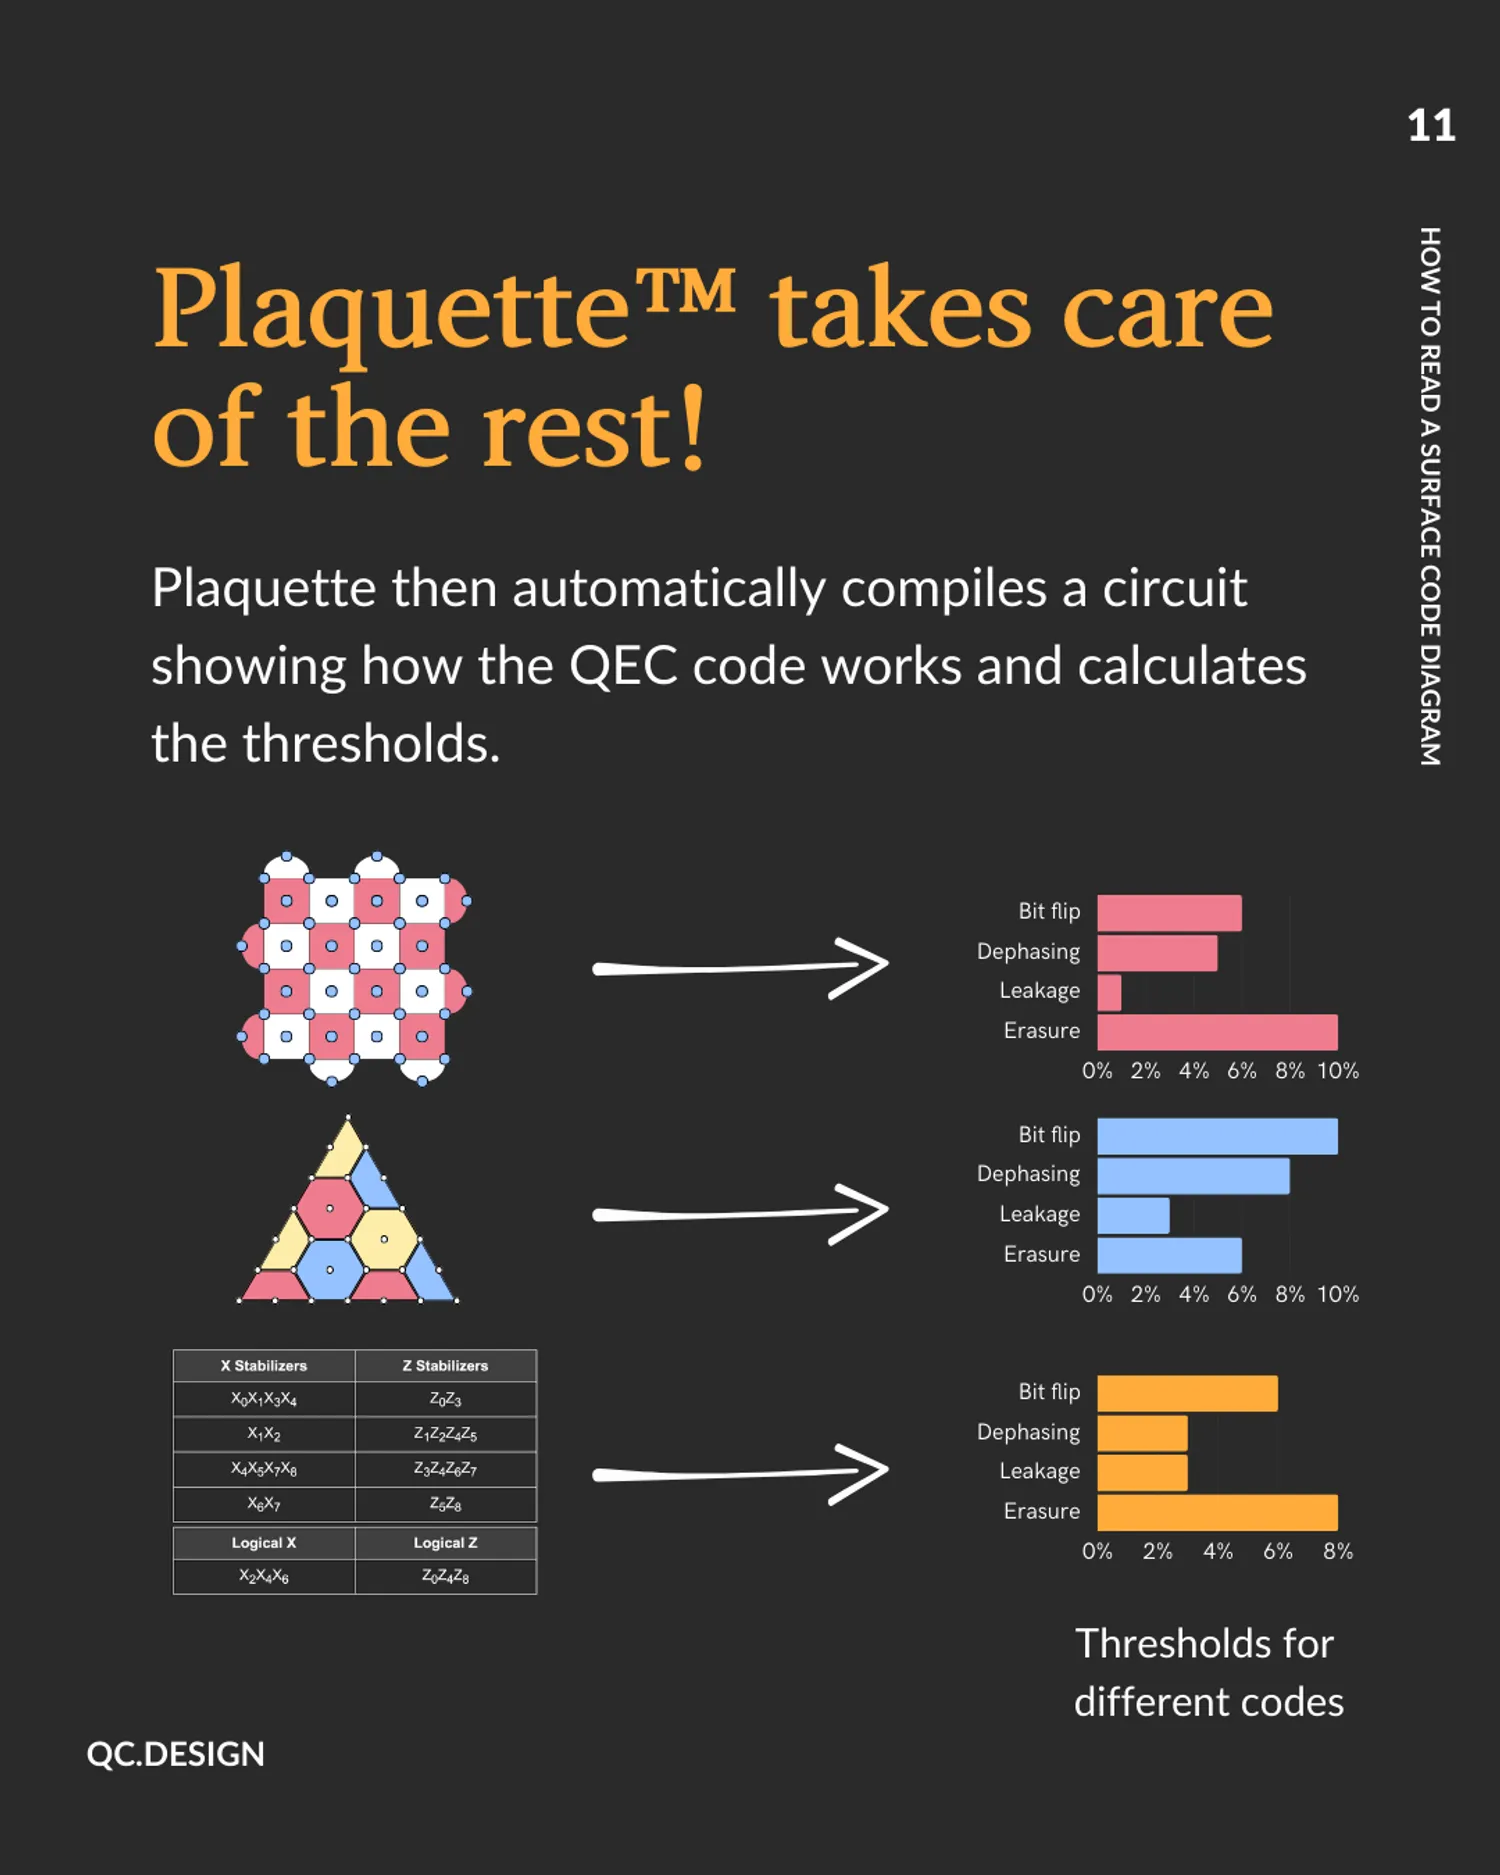
Plaquette then automatically compiles a circuit showing how the QEC code works and calculates respective fault tolerant thresholds.
If you’re curious how Plaquette can work for your platform, get in touch and we can share a demo.
Not ready yet? You can also join our practitioners mailing list to be notified when we release new features or publish technical content like this.

This post was originally published in January 2025 and updated in April 2026.